


Financial
statements
These financial statements have been approved for issue by the Board of Directors on 27 March 2019.
Income statement
| For the year ended 31 December 2018 | Note | Year to 31 Dec 2018 € million | Year to 31 Dec 2017 € million |
| Interest and similar income | |||
| From Banking loans | 1,064 | 974 | |
| From fixed-income debt securities and other interest | 348 | 173 | |
| Interest expense and similar charges | (831) | (429) | |
| Net interest income on derivatives | 170 | 36 | |
| Net interest income | 3 | 751 | 754 |
| Fee and commission income | 101 | 80 | |
| Fee and commission expense | (8) | (6) | |
| Net fee and commission income | 4 | 93 | 74 |
| Dividend income | 204 | 185 | |
| Net (losses)/gains from share investments at fair value through profit or loss | 5 | (176) | 147 |
| Net gains from loans | 6 | 25 | 5 |
| Net gains from Treasury assets held at amortised cost | 7 | – | 2 |
| Net gains from Treasury activities at fair value through profit or loss and foreign exchange | 8 | 34 | 47 |
| Fair value movement on non-qualifying and ineffective hedges | 9 | 21 | (20) |
| Impairment provisions on Banking loan investments | 10 | (192) | (3) |
| Impairment provisions on guarantees | – | 2 | |
| General administrative expenses | 11 | (391) | (395) |
| Depreciation and amortisation | 20, 21 | (29) | (26) |
| Net profit for the year from continuing operations | 340 | 772 | |
| Transfers of net income approved by the Board of Governors | 26 | (130) | (180) |
| Net profit after transfers of net income approved by the Board of Governors | 210 | 592 | |
| Attributable to: | |||
| Equity holders | 210 | 592 |
Statement of comprehensive income
| For the year ended 31 December 2018 | Note | Year to 31 December 2018 € million | Year to 31 December 2017 € million |
| Net profit after transfers of net income approved by the Board of Governors | 210 | 592 | |
| Other comprehensive income/(expense) | |||
| 1: Items that will not be reclassified subsequently to profit or loss | |||
| − (Losses)/gains on share investments designated as fair value through other comprehensive income | 19 | (1) | 1 |
| − Actuarial (losses)/gains on defined benefit scheme | 29 | (10) | 8 |
| 2: Items that may be reclassified subsequently to profit or loss | |||
| − Gains on cash flow hedges | 9 | 1 | 3 |
| − Losses on fair value hedges | 9 | (46) | – |
| − Losses on loans designated as fair value through other comprehensive income | 16 | (17) | – |
| Total comprehensive income | 137 | 604 | |
| Attributable to: | |||
| Equity holders | 137 | 604 |
Balance sheet
| At 31 December 2018 | Note | € million | 31-Dec-18 € million | € million | 31 Dec 2017 € million |
| Assets | |||||
| Placements with and advances to credit institutions | 12 | 16,014 | 14,605 | ||
| Debt securities | 13 | ||||
| At fair value through profit or loss | 1,604 | 916 | |||
| At amortised cost | 11,343 | 9,465 | |||
| 12,947 | 10,381 | ||||
| 28,961 | 24,986 | ||||
| Other financial assets | 14 | ||||
| Derivative financial instruments | 3,948 | 3,677 | |||
| Other financial assets | 381 | 352 | |||
| 4,329 | 4,029 | ||||
| Loan investments | |||||
| Banking portfolio: | |||||
| Loans at amortised cost | 15 | 22,413 | 22,630 | ||
| Less: Provisions for impairment | 10 | (981) | (850) | ||
| Loans at fair value through other comprehensive income | 16 | 1,737 | – | ||
| Loans at fair value through profit or loss | 17 | 460 | 372 | ||
| 23,629 | 22,152 | ||||
| Share investments | |||||
| Banking portfolio: | |||||
| At fair value through profit or loss | 18 | 4,745 | 4,834 | ||
| Treasury portfolio: | |||||
| Share investments at fair value through other comprehensive income | 19 | 75 | 76 | ||
| 4,820 | 4,910 | ||||
| Intangible assets | 20 | 62 | 62 | ||
| Property, technology and equipment | 21 | 50 | 54 | ||
| Total assets | 61,851 | 56,193 | |||
| Liabilities | |||||
| Borrowings | |||||
| Amounts owed to credit institutions and other third parties | 22 | 2,107 | 2,650 | ||
| Debts evidenced by certificates | 23 | 40,729 | 35,116 | ||
| 42,836 | 37,766 | ||||
| Other financial liabilities | 24 | ||||
| Derivative financial instruments | 2,079 | 1,824 | |||
| Other financial liabilities | 653 | 431 | |||
| 2,732 | 2,255 | ||||
| Total liabilities | 45,568 | 40,021 | |||
| Members’ equity attributable to equity holders | |||||
| Paid-in capital | 25 | 6,215 | 6,211 | ||
| Reserves and retained earnings | 26 | 10,068 | 9,961 | ||
| Total members’ equity | 16,283 | 16,172 | |||
| Total liabilities and members’ equity | 61,851 | 56,193 | |||
| Memorandum items | |||||
| Undrawn commitments | 27 | 13,068 | 12,770 |
Statement of changes in equity
| For the year ended 31 December 2018 | Subscribed capital € million | Callable capital € million | Revaluation reserve € million | Hedging reserve € million | Actuarial remeasurement € million | Retained earnings € million | Total equity € million |
| At 31 December 2016 | 29,703 | (23,496) | 19 | (2) | 6 | 9,328 | 15,558 |
| Total comprehensive income for the year | – | – | 1 | 3 | 8 | 592 | 604 |
| Internal tax for the year | – | – | – | – | – | 6 | 6 |
| Capital subscriptions | 20 | (16) | – | – | – | – | 4 |
| At 31 December 2017 | 29,723 | (23,512) | 20 | 1 | 14 | 9,926 | 16,172 |
| Effect of the adoption of IFRS 9 | – | – | 16 | – | – | (52) | (36) |
| At 31 December 2017 after adoption of IFRS 9 | 29,723 | (23,512) | 36 | 1 | 14 | 9,874 | 16,136 |
| Total comprehensive income for the year | – | – | (18) | (45) | (10) | 210 | 137 |
| Internal tax for the year | – | – | – | – | – | 6 | 6 |
| Capital subscriptions | 20 | (16) | – | – | – | – | 4 |
| At 31 December 2018 | 29,743 | (23,528) | 18 | (44) | 4 | 10,090 | 16,283 |
| Refer to note 26 “Reserves and retained earnings” for a further explanation of the Bank’s reserves. | |||||||
Statement of cash flows
| For the year ended 31 December 2018 | € million | Year to 31 Dec 2018 € million | € million | Year to 31 Dec 2017 € million |
| Cash flows from operating activities | ||||
| Net profit for the year | 210 | 592 | ||
| Adjustments to reconcile net profit to net cash flows: | ||||
| Non-cash items in the income statement | ||||
| Depreciation and amortisation | 29 | 26 | ||
| Gross provisions charge for Banking loan losses and guarantees | 192 | 1 | ||
| Fair value movement on share investments | (126) | 253 | ||
| Fair value movement on loans held at fair value through profit or loss | 19 | (3) | ||
| Fair value movement on Treasury investments | 75 | (67) | ||
| Other unrealised fair value movements | 23 | 163 | ||
| Cash flows from the sale and purchase of operating assets | ||||
| Proceeds from repayments of Banking loans | 6,301 | 7,552 | ||
| Funds advanced for Banking loans | (7,835) | (8,610) | ||
| Proceeds from sale of Banking share investments | 606 | 1,167 | ||
| Funds advanced for Banking share investments | (660) | (478) | ||
| Net cash flows from Treasury derivative settlements | (172) | (54) | ||
| Net placements to credit institutions | (1,780) | (4,353) | ||
| Working capital adjustment: | ||||
| Movement in interest income | 107 | (46) | ||
| Movement in interest expense | 65 | 34 | ||
| Movement in net fee and commission income | 12 | 5 | ||
| Movement in net income allocations payable | – | (220) | ||
| Movement in accrued expenses | 15 | 1 | ||
| Movement in dividend income receivable | – | (2) | ||
| Net cash used in operating activities | (2,919) | (4,039) | ||
| Cash flows from investing activities | ||||
| Proceeds from sale of debt securities at amortised cost | 9,350 | 12,153 | ||
| Purchases of debt securities at amortised cost | (11,201) | (13,108) | ||
| Proceeds from sale of debt securities at fair value through profit or loss | 2,415 | 4,192 | ||
| Purchases of debt securities at fair value through profit or loss | (3,052) | (4,181) | ||
| Purchase of intangible assets, property, technology and equipment | (24) | (19) | ||
| Cash flows used in investing activities | (2,512) | (963) | ||
| Cash flows from financing activities | ||||
| Capital received | 7 | 4 | ||
| Issue of debts evidenced by certificates | 27,711 | 22,367 | ||
| Redemption of debts evidenced by certificates | (23,014) | (19,615) | ||
| Net cash from financing activities | 4,704 | 2,756 | ||
| Net decrease in cash and cash equivalents | (727) | (2,246) | ||
| Cash and cash equivalents at beginning of the year | 6,271 | 8,517 | ||
| Cash and cash equivalents at 31 December19 | 5,544 | 6,271 | ||
| Cash and cash equivalents are amounts with less than three months to maturity from the date of the transactions, which are available for use at short notice and are subject to insignificant risk of change in value. Within the 31 December 2018 balance is €8 million restricted for technical assistance to be provided to member economies in the SEMED region (2017: €8 million). | ||||
Accounting policies
The principal accounting policies applied in the preparation of these financial statements are set out below. These policies have been consistently applied to all the years presented, unless otherwise stated.
A. Basis of preparation
These financial statements have been prepared in accordance with International Financial Reporting Standards (IFRS) as issued by the International Accounting Standards Board (IASB). The financial statements have been prepared under the historical cost convention, as modified by the revaluation of financial assets at fair value through other comprehensive income, financial assets and financial liabilities held at fair value through profit or loss and all derivative contracts. In addition, financial assets and liabilities subject to amortised cost measurement which form part of a qualifying hedge relationship have been accounted for in accordance with hedge accounting rules – see “Derivative financial instruments and hedge accounting”.
The financial statements have been prepared on a going concern basis. The going concern assessment was made by the Bank’s Board of Directors when approving the Bank’s “Strategy Implementation Plan 2019-21” in December 2018, which analysed the Bank’s liquidity position. The assessment was re-confirmed by the President and Senior Vice President, Chief Financial Officer and Chief Operating Officer on 27 March 2019, the date on which they signed the financial statements.
The preparation of financial statements in conformity with IFRS requires the use of certain critical accounting estimates. It also requires management to exercise its judgement in the process of applying the Bank’s policies. The areas involving a higher degree of judgement or complexity, or areas where judgements and estimates are significant to the financial statements, are disclosed in “Critical accounting estimates and judgements”.
New and amended IFRS mandatorily effective for the current reporting period
There are a number of new standards and amendments to existing standards effective for the current reporting period which have no or negligible impact on the Bank’s financial statements, namely:
- IFRS 15: Revenue from Contracts with Customers
- IFRIC 22: Foreign Currency Transactions and Advance Consideration
- Amendments to IFRS 2: Share-based Payment
- Amendments to IFRS 4: Insurance Contracts
- Amendments to IAS 40: Investment Property
In addition, IFRS 9: Financial Instruments became effective in the current reporting period. The standard has developed in phases and was completed in July 2014 with a mandatory application date for annual reporting periods beginning on or after 1 January 2018. The Bank adopted the first phase “recognition and measurement of financial assets” (November 2009) in its 2010 financial statements. For details of the impact of implementing the finalised standard see the significant accounting policies section.
IFRS not yet mandatorily effective and not adopted early
The following standards are not yet effective and have not been adopted early.
| Pronouncement | Nature of change | Potential impact |
| Amendments to: IAS 19: Employee Benefits | Aims to harmonise accounting practices relating to retirement benefit plan amendments, curtailments or settlements. Effective for annual reporting periods beginning on or after 1 January 2019. | The Bank anticipates no material impact as a result of adopting the changes to the standard. |
| Amendments to: IFRS 9: Financial Instruments | Clarifies the classification of financial assets with prepayment features and the accounting for financial liabilities following a modification. Effective for annual reporting periods beginning on or after 1 January 2019. | The Bank anticipates no material impact as a result of adopting the changes to the standard. |
| IFRS 16: Leases | Sets out the principles for the recognition, measurement, presentation and disclosure of leases for both parties to a contract, that is, the customer (lessee) and the supplier (lessor). Effective for annual reporting periods beginning on or after 1 January 2019. | The Bank anticipates no material impact as a result of adopting this standard. |
| Amendments to: IAS 1: Presentation of Financial Statements and IAS 8: Accounting Policies, Changes in Accounting Estimates and Errors | Provides clarifications on the definition of “material”. Effective for annual reporting periods beginning on or after 1 January 2020. | The Bank anticipates no material impact as a result of adopting the changes to these standards. |
| IFRS 3: Business Combinations | Provides guidance for when to account for acquisitions either as either a business or as a group of assets. Effective for annual reporting periods beginning on or after 1 January 2020. | The Bank anticipates no material impact as a result of adopting this standard. |
| IFRS 17: Insurance Contracts | Establishes principles for the recognition, measurement, presentation and disclosure of insurance contracts issued. It also requires similar principles to be applied to reinsurance contracts held and investment contracts with discretionary participation features issued. Effective for annual reporting periods beginning on or after 1 January 2021. | The Bank has yet to assess the impact of this standard. |
B. Significant accounting policies
From 1 January 2018, the Bank has applied the complete standard IFRS 9: Financial Instruments as issued by the IASB in July 2014. Prior to this date, the Bank had early adopted the first instalment of IFRS 9: Financial Instruments (November 2009), concerning the classification and measurement of financial assets, with effect from 1 January 2010. Consistent with the transition rules for IFRS 9 implementation, there has been no restatement of 2017 comparatives using the new standard. Where the adoption of the new standard has led to a change in the Bank’s accounting policies, the differing policies prior to and after 1 January 2018 are described below, together with details of the impact of applying the new policies.
Financial assets – Classification and measurement – prior to 1 January 2018
Pursuant to the Bank’s early adoption of the first instalment of IFRS 9: Financial Instruments (November 2009) in 2010, the Bank classified the majority of its financial assets in the following categories: those measured at amortised cost and those measured at fair value through profit or loss.20 This classification depended on both the contractual characteristics of the assets and the business model adopted for their management.
Financial assets – Classification and measurement – from 1 January 2018
The classification of the Bank’s financial assets continues to depend on both the contractual characteristics of the assets and the business model adopted for their management. Based on this, financial assets are now classified in one of three categories: those measured at amortised cost, those measured at fair value through other comprehensive income, and those measured at fair value through profit or loss.
Financial assets at amortised cost
An investment is classified as “amortised cost” only if both of the following criteria are met: the objective of the Bank’s business model is to hold the asset to collect the contractual cash flows; and the contractual terms give rise on specified dates to cash flows that are solely payments of principal and interest on the principal outstanding, interest being consideration for the time value of money and the credit risk associated with the principal amount outstanding.
Investments meeting these criteria are measured initially at fair value plus transaction costs that are directly attributable to the acquisition of the financial assets. They are subsequently measured at amortised cost using the effective interest method less any impairment. Except for debt securities held at amortised cost, which are recognised on trade date, the Bank’s financial assets at amortised cost are recognised at settlement date.
Financial assets at fair value through other comprehensive income – prior to 1 January 2018
The Bank accounted for a small number of strategic equity investments
21 at fair value through other comprehensive income with no recycling of such fair value gains or losses through the income statement. Such a classification is available only for equity investments that are not held for trading purposes following an irrevocable election to do so at the point of initial recognition.
Financial assets at fair value through other comprehensive income – from 1 January 2018
In addition to the previous class of financial assets at fair value through other comprehensive income, a new category is also available whereby gains or losses recognised in other comprehensive income are subsequently recognised in the income statement. This new classification is applicable following the implementation of IFRS 9: Financial Instruments (2014), and hence there are no assets classified as such in 2017 or before. An investment is classified as “fair value through other comprehensive income” in this manner only if both of the following criteria are met: the objective of the Bank’s business model is achieved by both holding the asset to collect the contractual cash flows and selling the asset; and the contractual terms give rise on specified dates to cash flows that are solely payments of principal and interest on the principal outstanding, interest being consideration for the time value of money and the credit risk associated with the principal amount outstanding.
Investments meeting these criteria are measured initially at fair value plus transaction costs that are directly attributable to the acquisition of the financial assets. They are subsequently measured at fair value, but the gains and losses on these investments recognised in the income statement are measured using the effective interest method less any impairment. The difference between the fair value gains and losses and the gains and losses recognised in the income statement is recognised in the statement of other comprehensive income. The Bank’s financial assets at fair value through other comprehensive income are recognised at settlement date.
The below table outlines the impact on the 2018 opening balances as a result of the reclassification of existing financial assets to the new classification:22
| Carrying amount 1 January 18 € million | Reclassification € million | Remeasurement € million | IFRS 9 Impairment Implementation | Restated 1 January 18 € million |
|
| Amortised Cost | |||||
| Loans at amortised cost | 22,630 | (1,179) | – | – | 21,451 |
| Provisions for impairment | (850) | 5 | – | (52) | (897) |
| Fair value through other comprehensive income | |||||
| Loans at fair value through other comprehensive income | – | 1,174 | 16 | – | 1,190 |
| Reserves | |||||
| Reserves and retained earnings | 9,961 | – | 16 | (52) | 9,925 |
Financial assets at fair value through profit or loss
If neither of the two classifications above apply, the financial asset is classified as “fair value through profit or loss”. The presence of an embedded derivative, which could potentially change the cash flows arising on a financial asset so that they no longer represent solely payments of principal and interest, requires that instrument to be classified at fair value through profit or loss, an example being a convertible loan.
Financial assets classified at fair value through profit or loss are recognised on a settlement date basis if within the Banking loan portfolio and on a trade date basis if within the Treasury portfolio.
The Bank’s share investments – equity investments held within its Banking portfolio – are measured at fair value through profit or loss, including associate investments. The Bank considers the latter to be venture capital investments for which IAS 28: Investments in Associates and Joint Ventures does not require the equity method of accounting.
When an instrument that is required to be measured at fair value through profit or loss has characteristics of both a debt and equity instrument, the Bank determines its classification as a debt or an equity instrument on the basis of the legal rights and obligations attaching to the instrument in accordance with IFRS.
The basis of fair value for listed share investments in an active market is the quoted bid market price on the balance sheet date.
The basis of fair value for share investments that are either unlisted or listed in an inactive market is determined using valuation techniques appropriate to the market and industry of each investment. The primary valuation techniques used are net asset value and earnings-based valuations to which a multiple is applied based on information from comparable companies and discounted cash flows. Techniques used to support these valuations include industry valuation benchmarks and recent transaction prices.
The Bank’s share investments are recognised on a trade date basis.
At initial recognition, the Bank measures these assets at their fair value. Transaction costs of financial assets carried at fair value through profit or loss are expensed in the income statement. Such assets are carried at fair value on the balance sheet with changes in fair value included in the income statement in the period in which they occur.
Derecognition of financial assets
The Bank derecognises a financial asset, or a portion of a financial asset, where the contractual rights to that asset have expired or where the rights to further cash flows from the asset have been transferred to a third party and, with them, either:
- substantially all the risks and rewards of the asset or
- significant risks and rewards, along with the unconditional ability to sell or pledge the asset.
Where significant risks and rewards have been transferred, but the transferee does not have the unconditional ability to sell or pledge the asset, the Bank continues to account for the asset to the extent of its continuing involvement. Where neither derecognition nor continuing involvement accounting is appropriate, the Bank continues to recognise the asset in its entirety and recognises any consideration received as a financial liability.
Financial liabilities
With the exception of derivative instruments that must be measured at fair value, and the Bank’s obligations to the Equity Participation Fund,22 the Bank does not designate any financial liabilities at fair value through profit or loss. All are measured at amortised cost, unless they qualify for hedge accounting in which case the amortised cost is adjusted for the fair value movements attributable to the risks being hedged. Liabilities deriving from issued securities are recognised on a trade date basis with other liabilities on a settlement date basis.
Interest expense is accrued using the effective interest rate method and is recognised within the “interest expense and similar charges” line of the income statement, except for the allocated cost of funding Treasury’s trading assets which is recognised within “net gains from Treasury activities at fair value through profit or loss”.
Where a financial liability contains an embedded derivative, which is of a different economic character to the host instrument, that embedded derivative is bifurcated and measured at fair value through the income statement. IFRS 9 does not require bifurcation of embedded derivatives in the case of financial assets.
Contingent liabilities
Contingent liabilities are possible obligations arising from past events, whose existence will be confirmed only by uncertain future events, or present obligations arising from past events that are not recognised because either an outflow of economic benefits is not probable or the amount of the obligation cannot be reliably measured. Contingent liabilities are not recognised but information about them is disclosed unless the possibility of any outflow of economic benefits in settlement is remote.
Derivative financial instruments and hedge accounting
The Bank primarily makes use of derivatives for five purposes:
- The majority of the Bank’s issued securities, excluding commercial paper, are individually paired with a swap to convert the issuance proceeds into the currency and interest rate structure sought by the Bank.
- To manage the net interest rate risks and foreign exchange risks arising from all of its financial assets and liabilities.
- To provide potential exit strategies for its unlisted equity investments through negotiated put options.
- Through currency swaps, to manage funding requirements for the Bank’s loan portfolio.
- To manage the foreign exchange risks arising from the Bank’s expenses, the majority of which are incurred in pound sterling.
All derivatives are measured at fair value through profit and loss unless they form part of a qualifying cash flow hedge, in which case the fair value is taken to reserves and released into the income statement at the same time as the risks on the hedged cash flows are recognised therein. Any hedge ineffectiveness will result in the relevant proportion of the fair value remaining in the income statement.
Derivative fair values are derived primarily from discounted cash flow models, option pricing models and from third party quotes. Derivatives are carried as assets when their fair values are positive and as liabilities when their fair values are negative. In 2016 the Bank introduced additional valuation measures for its over-the-counter (OTC)23 derivatives portfolio to reflect credit and funding cost adjustments which the Bank reasonably anticipates will be incorporated into the exit price for such instruments. These adjustments, calculated at a portfolio level for each individual counterparty, allow for the following factors:
- The credit valuation adjustment (CVA) reflects the impact on the price of a derivative trade of changes in the credit risk associated with the counterparty
- The debit valuation adjustment (DVA) reflects the impact on the price of a derivative trade of changes in the credit risk associated with the EBRD
- The funding valuation adjustment (FVA) reflects the costs and benefits arising when uncollateralised derivative exposures are hedged with collateralised trades
In line with market practice, in 2017 the Bank added valuation adjustments to these derivatives attributable to “cheapest-to-deliver” factors, reflecting the value of terms and conditions relating to the posting of collateral in the Bank’s Credit Support Annexes (CSA) to the ISDA Master Agreements.
The valuation adjustment deriving from these factors is detailed within the Risk Management section of the report.
Hedge accounting
Hedge accounting is designed to bring accounting consistency to financial instruments that would not otherwise be permitted. A valid hedge relationship exists when a specific relationship can be identified between two or more financial instruments in which the change in value of one instrument (the hedging instrument) is highly negatively correlated to the change in value of the other (the hedged item).
The Bank applies hedge accounting treatment to individually identified hedge relationships. The Bank documents the relationship between hedging instruments and hedged items upon initial recognition of the transaction. The Bank also documents its assessment, on an ongoing basis, of whether the derivatives that are used in hedging transactions are highly effective in offsetting changes in fair values or cash flows of hedged items. The fair value gains and losses associated with these hedge relationships is recognised within “Fair value movement on non-qualifying and ineffective hedges”. Also included within this caption of the income statement are the gains and losses attributable to derivatives that the Bank uses for hedging interest-rate risk on a macro basis, but for which the Bank does not apply hedge accounting.
Fair value hedges – prior to 1 January 2018
The Bank’s hedging activities are primarily designed to mitigate interest rate risk by using swaps to convert the interest rate risk profile, on both assets and liabilities, into floating rate risk. Such hedges are known as “fair value” hedges. Changes in the fair value of the derivatives that are designated and qualify as fair value hedges, and that prove to be highly effective in relation to hedged risk, are included in the income statement, along with the corresponding change in fair value of the hedged asset or liability that is attributable to that specific hedged risk.
The Bank did not adopt early the part of IFRS 9 which relates to hedge accounting and therefore still applied IAS 39: Financial Instruments prior to 1 January 2018. To qualify for hedge accounting under IAS 39 the correlation of the changes in value between the hedged item and the hedging instrument must be within a range of 80 to 125 per cent, with any ineffectiveness within these boundaries recognised within “Fair value movement on non-qualifying and ineffective hedges” in the income statement.
Fair value hedges – from 1 January 2018
To qualify for hedge accounting under IFRS 9 there is no longer a mathematical test over the correlation of the changes in value between the hedged item and the hedging instrument. Instead, there must be a demonstrable economic relationship between the hedged item and the hedging instrument, where credit risk is not a dominant factor in the value changes expected in that relationship. In practice, the application of these qualifying criteria at the Bank has permitted a number of hedging relationships previously disqualified from hedge accounting under IFRS 9 to be reclassified as hedges from 1 January 2018.
One of the principal causes of ineffectiveness in the Bank’s fair value hedging relationships is the foreign currency basis spread, a pricing factor applicable to the cross-currency swaps designated as hedging items in many of the Bank’s hedge relationships. Changes in foreign currency basis risk leads to hedge ineffectiveness as it causes movements in the value of the hedging instrument, the cross-currency swap, but does not directly lead to movements in the value of the hedged item. The Bank applies the option available under IFRS to separate the foreign currency basis spread of a financial instrument in a hedging relationship, with changes in its value recognised in other comprehensive income. The amounts recognised in other comprehensive income are subsequently amortised through the income statement over the remaining life of the hedging relationship in “Fair value movement on non-qualifying and ineffective hedges”.
Any remaining ineffectiveness arising from the Bank’s fair value hedging relationships after separating the foreign currency basis risk is recognised in “Fair value movement on non-qualifying and ineffective hedges” in the income statement.
As the changes in hedge accounting rules on implementation of IFRS 9 require prospective application, there was no impact on the 2018 opening balances arising from the change.
Cash flow hedges
The Bank has engaged in cash flow hedges to minimise the exchange rate risk associated with the fact that the majority of its administrative expenses are incurred in pound sterling. The amount and timing of such hedges fluctuate in line with the Bank’s view on opportune moments to execute the hedges. In December 2018 the Bank purchased in the forward foreign exchange market approximately forty per cent of the pound sterling figure for the 2019 budget. The movement in the fair value of these hedges will be recognised directly in reserves until such time as the relevant expenditure is incurred, when the hedge gains or losses will be reflected as part of the euro-equivalent expenses for the year.
For further information on risk and related management policies see the Risk Management section.
Financial guarantees
Issued financial guarantees are initially recognised at their fair value, and subsequently measured at the higher of the unamortised balance of the related fees received and deferred, and the expected credit loss (ECL) at the balance sheet date. The latter is recognised when it is both probable that the guarantee will need to be settled and that the settlement amount can be reliably estimated. Financial guarantees are recognised within other financial assets and other financial liabilities.
Impairment of financial assets
Financial assets at amortised cost – performing assets prior to 1 January 2018
Provisions for impairment of classes of similar assets that are not individually identified as impaired are calculated on a portfolio basis (the general provision). The methodology used for assessing such impairment is based on a risk-rated approach, with the methodology applied for all sovereign risk assets taking into account the Bank’s preferred creditor status afforded by its members. Under IAS 39, the Bank’s methodology calculated impairment on an incurred loss basis. Impairment was deducted from the asset categories on the balance sheet and charged to the income statement.
The Bank additionally made transfers within its reserves to maintain a separate loan loss reserve to supplement the cumulative amount provisioned through the Bank’s income statement on an incurred loss basis.
Financial assets at amortised cost – performing assets from 1 January 2018 (Stages 1 and 2)
Provisions for impairment of classes of similar assets that are not individually identified as impaired continue to be calculated on a portfolio basis (the general provision), but with several changes from the previous model under IAS 39. Under IFRS 9 the Bank’s methodology is to calculate impairment on an expected credit loss basis.
A “three-stage” model for impairment is applied based on changes in credit quality since origination,24 with the stage allocation being based on the financial asset’s probability of default (PD). At origination loans are classified in Stage 1. If there is subsequently a significant increase in credit risk associated with the asset, it is then reallocated to Stage 2. The transition from Stage 1 to Stage 2 is significant because provisions for Stage 1 assets are based on expected losses over a 12-month horizon, whereas Stage 2 assets are provisioned based on lifetime expected losses. When objective evidence of impairment is identified, the asset is reallocated to Stage 3 as described below.
The staging model relies on a relative assessment of credit risk, that is, a loan with the same characteristics could be included in Stage 1 or in Stage 2, depending on the credit risk at origination of the loan. As a result, an entity could have different loans with the same counterparty that are included in different stages of the model, depending on the credit risk that each loan had at origination.
For Stage 1 and Stage 2 assets impairment is deducted from the asset categories on the balance sheet and charged to the income statement. The Bank additionally makes transfers within its reserves, maintaining a separate loan loss reserve to supplement the cumulative amount provisioned through the Bank’s income statement for Stage 1 assets. The amounts held within the loan loss reserve equate to the difference between the ECL calculated on a lifetime basis and the ECL calculated over a 12-month horizon for the assets held in Stage 1.
Applying the IFRS 9 model for impairment at 1 January 2018 increased impairment by €52 million, with the increase being recognised as a reduction to the brought forward balance of reserves and retained earnings.25
Financial assets at amortised cost – non-performing assets (Stage 3)
There is no significant difference in the accounting for non-performing assets between IAS 39 and IFRS 9. Where there is objective evidence that an identified loan asset is impaired, specific provisions for impairment are recognised in the income statement, and under IFRS 9, the asset is classified in Stage 3. The criteria that the Bank uses to determine that there is objective evidence of an impairment loss include:
- delinquency in contractual payments of principal or interest
- cash flow difficulties experienced by the borrower
- breach of loan covenants or conditions
- initiation of bankruptcy proceedings
- deterioration in the borrower’s competitive position
- deterioration in the value of collateral.
Impairment is quantified as the difference between the carrying amount of the asset and the net present value of expected future cash flows discounted at the asset’s original effective interest rate where applicable. The carrying amount of the asset is reduced through the use of an allowance account and the amount of the loss is recognised in the income statement. After initial impairment, subsequent adjustments include the unwinding of the discount in the income statement over the life of the asset, and any adjustments required in respect of a reassessment of the initial impairment.
The carrying amount of the asset is reduced directly only through repayment or upon write-off. When a loan is deemed uncollectible the principal is written off against the related impairment provision. Such loans are written off only after all necessary procedures have been completed and the amount of the loss has been determined. Recoveries are credited to the income statement if previously written off.
Loans and advances may be renegotiated in response to an adverse change in the circumstances of the borrower. Depending upon the degree to which the original loan is amended, it may continue to be recognised or will be derecognised and replaced with a new loan. To the extent the original loan is retained, it will continue to be shown as overdue if appropriate and individually impaired where the renegotiated payments of interest and principal will not recover the original carrying amount of the asset.
Statement of cash flows
The statement of cash flows is prepared using the indirect method. Cash and cash equivalents comprise balances with less than three months maturity from the date of the transaction, which are available for use at short notice and that are subject to insignificant risk of changes in value.
Foreign currencies
The Bank’s reporting currency for the presentation of its financial statements is the euro.
Foreign currency transactions are initially translated into euro using the exchange rates prevailing at the dates of the transactions. Foreign exchange gains and losses resulting from the settlement of such transactions, and from the translation at the year-end exchange rate of monetary assets and liabilities denominated in foreign currencies, are included in the income statement, except when deferred in reserves as qualifying cash flow hedges.
Capital subscriptions
The Bank’s share capital is denominated in euro and is divided into paid-in and callable shares. Paid-in shares are recognised on the balance sheet as members’ equity. Callable shares will not be recorded on the balance sheet unless the Bank exercises its right to call the shares.
Intangible assets
Costs associated with maintaining computer software programmes are recognised as an expense as incurred. Costs that are directly associated with identifiable and unique software products controlled by the Bank, and that will generate economic benefits exceeding costs beyond one year, are recognised as intangible assets. Direct costs include the staff costs of the software development team and an appropriate portion of relevant overheads.
Expenditure that enhances or extends the performance of computer software programmes beyond their original specifications is recognised as a capital improvement and is added to the original cost of the software. Computer software development costs recognised as intangible assets are amortised using the straight-line method over an estimated life of three to ten years.
Property, technology and equipment
In 2017 the Bank took legal ownership of a stock of railcars in part settlement of a loan which was in default and which had been fully provisioned. The loan and associated provision were each reduced by the value attributed to the railcars. The railcars are classified as “property, technology and equipment” with income generated from the operation of the railcars classified as fee and commission income.
Property, technology and equipment is stated at cost less accumulated depreciation. Depreciation is calculated on the straight-line method to write off the cost of each asset to its residual value over the estimated life as follows:
| Freehold property | 30 years |
| Improvements on leases of less than 50 years unexpired | Unexpired periods |
| Technology and office equipment | Between three and ten years |
| Other (railcars) | 20 years |
Accounting for leases
Leases of assets under which all the risks and benefits of ownership are effectively retained by the lessor are classified as operating leases. The Bank has entered into such leases for its office accommodation, both in its UK Headquarters and its Resident Offices in other economies in which it has a presence. Payments made under operating leases are charged to the income statement on a straight-line basis over the period of the lease. When an operating lease is terminated before the lease period has expired, any payment required to be made to the lessor by way of penalty is recognised as an expense in the period in which the termination takes place.
Interest, fees, commissions and dividends
Interest income and expense is recognised on an accruals basis using the effective interest rate method. The effective interest rate is the rate that exactly discounts estimated future payments or receipts to the gross carrying amount of the financial instrument. This method requires that, in addition to the contractual interest rate attaching to a financial instrument, those fees and direct costs associated with originating the instrument are also recognised as interest income or expense over the life of the instrument. Further details are provided below.
- Banking loans: this represents interest income on banking loans. Interest is recognised on impaired loans through unwinding the discount used in deriving the present value of expected future cash flows.
- Fixed-income debt securities and other: this represents interest income on Treasury investments with the exception of those measured at fair value where the interest is recognised in “net gains from Treasury activities at fair value through profit or loss”. Where hedge accounting is applied to an underlying investment – typically using a swap to convert fixed-rate interest into floating – the net interest of the swap is included within this interest income line.
- Interest expense and similar charges: this represents interest expense on all borrowed funds. The majority of the Bank’s borrowings are undertaken through the issuance of bonds that are usually paired with a one-to-one swap to convert the proceeds into the currency and floating rate profile sought by the Bank. Hedge accounting is applied to such relationships and the net interest of the associated swap is included within interest expense.
- Net interest income/(expense) on derivatives: in addition to swaps where the interest is associated with specific investments or borrowings, the Bank also employs a range of derivatives to manage the risk deriving from interest rate mismatches between the asset and liability side of the balance sheet. The net interest associated with these derivatives is presented separately as it is not identifiable to individual assets or liabilities presented elsewhere within “net interest income”. This lack of specific “matching” also means that hedge accounting is not applied in respect of the risks hedged by these derivatives.
Fees received in respect of services provided over a period of time, including loan commitment fees are recognised as income as the services are provided. Other fees and commissions are classed as income when received. Issuance fees and redemption premiums or discounts are amortised over the period to maturity of the related borrowings on an effective yield basis.
Dividends relating to share investments are recognised in accordance with IFRS 15 when the Bank’s right to receive payments has been established, and when it is probable that the economic benefits will flow to the Bank and the amount can be reliably measured.
Staff retirement schemes
The Bank has a defined contribution scheme and a defined benefit scheme to provide retirement benefits to its staff. The Bank keeps all contributions to the schemes, and all other assets and income held for the purposes of the schemes, separately from all of its other assets.
Under the defined contribution scheme, the Bank and staff contribute to provide a lump sum benefit, such contributions being charged to the income statement and transferred to the scheme’s independent custodians.
The defined benefit scheme is funded entirely by the Bank and benefits are based on years of service and a percentage of final gross base salary as defined in the scheme. Independent actuaries calculate the defined benefit obligation at least every three years by using the projected unit credit method. The present value of the defined benefit obligation is determined by discounting the estimated future cash outflows (relating to service accrued to the balance sheet date) using the yields available on high-quality corporate bonds. For intermediate years, the defined benefit obligation is estimated using approximate actuarial roll-forward techniques that allow for additional benefit accrual, actual cash flows and changes in the underlying actuarial assumptions.
The Bank’s contributions to the defined benefit scheme are determined by the Retirement Plan Committee, with advice from the Bank’s actuaries, and the contributions are transferred to the scheme’s independent custodians.
The defined benefit cost charged to the income statement represents the service cost, the net interest income/(cost) and any foreign exchange movements on the plan’s net asset or liability. Remeasurements due to actuarial assumptions, including the difference between expected and actual net interest, are recognised in “other comprehensive income”. The net defined benefit or liability recognised on the balance sheet is equal to the actual surplus or deficit of the defined benefit plan.
Taxation
In accordance with Article 53 of the Agreement, within the scope of its official activities, the Bank, its assets, property and income are exempt from all direct taxes. Taxes and duties levied on goods or services are likewise exempted or reimbursable except for those parts of taxes or duties that represent charges for public utility services.
C. Critical accounting estimates and judgements
Preparing financial statements in conformity with IFRS requires the Bank to make estimates that affect the reported amounts of assets and liabilities at the date of the financial statements and the reported amounts included in the income statement during the reporting period. Estimates are continually evaluated and are based on historical experience and other factors, including expectations of future events that are believed to be reasonable under the circumstances.
These estimates are highly dependent on a number of variables that reflect the economic environment and financial markets of the economies in which the Bank invests, but which are not directly correlated to market risks such as interest rate and foreign exchange risk. The Bank’s critical accounting estimates are outlined below.
Fair value of derivative financial instruments
The fair values of the Bank’s derivative financial instruments are determined by using discounted cash flow models. These cash flow models are based on underlying market prices for currencies, interest rates and option volatilities. Where market data are not available for all elements of a derivative’s valuation, extrapolation and interpolation of existing data has been used. Where unobservable inputs have been used, a sensitivity analysis has been included under “fair value hierarchy” within the Risk Management section.
Fair value of Banking loans at fair value through profit or loss
The fair values of the Bank’s loans at fair value through profit or loss are determined by using a combination of discounted cash flow models and options pricing models. These models incorporate market data pertaining to interest rates, a borrower’s credit spreads, underlying equity prices and dividend cash flows. Where relevant market data are not available extrapolation and interpolation of existing data has been used. Where unobservable inputs have been used, a sensitivity analysis has been included under “fair value hierarchy” within the Risk Management section of the report.
Fair value of share investments
The Bank’s method for determining the fair value of share investments is described under “Financial assets” in the Accounting Policies section of the report and an analysis of the share investment portfolio is provided in note 18. In relation to the Bank’s share investments where the valuations are not based on observable market inputs, additional sensitivity information has been included under “fair value hierarchy” in the Risk Management section.
Provisions for the impairment of loan investments
The Bank’s method for determining the level of impairment of loan investments is described within the Accounting Policies section of the report and further explained under credit risk within the Risk Management section.
During 2018 the Bank implemented IFRS 9 impairment rules, moving from an “incurred loss” model (that is, a loss event must have occurred in order to recognise a provision) to a forward looking “expected credit loss” model (that is, provisions should be recognised in anticipation of future loss events). For more information about this change see the significant accounting policies section.
In accordance with IFRS 9, ECL represents the average credit losses weighted by the probabilities of default (PD), whereby credit losses are defined as the present value of all cash shortfalls. The ECL is calculated for both Stage 1 and Stage 2 loans by applying the provision rate to the projected exposure at default (EAD), and discounting the resulting provision using the loan’s effective interest rate (EIR). The provision rate is generated by multiplying the PD rate and the loss given default (LGD) rate applicable to the loan.
A number of critical accounting estimates and judgements are therefore made in the calculation of impairment of loan investments.
Stage assessment
In order to determine whether there has been a significant increase in the credit risk since origination and hence transition to Stage 2 a combination of quantitative and qualitative risk metrics are employed. All loans with a 3-notch downgrade in PD on the Bank’s internal ratings scale since origination, all loans for which the contractual payments are overdue by between 31 and 89 days inclusive, as well as all loans placed on the “watch list” are transitioned to Stage 2.26
Point-in-time PD rates
To calculate expected credit losses for both Stage 1 and Stage 2 assets, a default probability is mapped to each PD rating using historical default data. The Bank uses forward looking point-in-time (PIT) PD rates to calculate the ECL. The PIT PD rates are derived from through-the-cycle (TTC) PD rates adjusted for projected macroeconomic conditions. The cumulative TTC PD rates used in 2018 are set out by internal rating grade below:
| PD rating 27 | External rating equivalent | 1-year horizon | 2-year horizon | 3-year horizon | 4-year horizon | 5-year horizon |
| 1.0 | AAA | 0.01% | 0.03% | 0.13% | 0.24% | 0.35% |
| 2.0 | AA | 0.02% | 0.06% | 0.15% | 0.26% | 0.37% |
| 3.0 | A | 0.06% | 0.15% | 0.24% | 0.36% | 0.49% |
| 4.0 | BBB | 0.17% | 0.43% | 0.68% | 1.05% | 1.42% |
| 5.0 | BB | 0.29% | 0.85% | 1.51% | 2.27% | 3.04% |
| 6.0 | B | 1.42% | 3.05% | 4.36% | 5.59% | 6.60% |
| 7.0 | CCC | 9.18% | 13.55% | 17.44% | 20.48% | 23.18% |
TTC PD rates express the likelihood of a default based on long-term credit risk trend rates and are constructed by using external benchmarks for investment grades and blending internal default experience with external data, assigning 75 per cent weight to the Bank’s internal experience, and 25 per cent to emerging markets data published by Standards & Poor’s for sub-investment grades. These are then adjusted based on analysis of the Bank’s historical default experience in relation to the macroeconomic environment prevailing at the time of default. The Bank has broken down TTC PD rates into PD rates applicable during periods of macroeconomic growth and recession. Consequently forward-looking country-specific probabilities of macroeconomic growth and recession are a key driver of PIT PD rates, and therefore a key driver of the level of impairment recognised by the Bank.
Update of historical default data
In 2018 the Bank carried out its regular annual review of the loss parameters underpinning estimates of unidentified impairment, with the aim of better reflecting the Bank’s loss experience. The key revision to these estimates was in determining the probabilities of default for each risk rating,28 the historical data used to calibrate the rates were updated to include 2017 data. This was carried out for both the internal and external data used to determine the final probability of default rates.29
There was an overall improvement in the TTC PD rates from 2016 to 2017. As a result, retaining the old PD rates would have increased the 2018 general provisions by €14 million.
Loss given default rates
An LGD rate is assigned to individual facilities indicating how much the Bank expects to lose on each facility if the borrower defaults. The rates for senior and subordinated loans are in accordance with the Foundation-IRB30 approach under the Basel Accord, and rates for covered bonds are in line with the guidance provided by the European Banking Authority. The resulting average LGD rate for the non-sovereign portfolio is consistent with the Bank’s long-term recovery experience.
In the case of a sovereign default, the Bank believes that its payment would be more likely to remain uninterrupted, benefitting from its preferred creditor status. These features are reflected in the LGD rate assigned to a sovereign exposure. Different categories of LGD rates are established based on the ability of the state to extend preferred credit status primarily through reviewing the proportion of preferred creditor debt to overall public debt and the overall institutional and governance effectiveness. Sub-sovereign recovery rates are adjusted in line with the recovery rates associated with the respective sovereigns.
Guarantors
Where the Bank’s loans are fully and unconditionally guaranteed, and the PD and/or LGD rating of the guarantor is better than the PD and/or LGD rating of the borrower, the ECL is based on the better of the PD and LGD ratings of the borrower and the guarantor.
Exposure at default
EAD estimates the outstanding balance at the point of default. EAD is modelled at an individual loan level, with all future expected cash flows including disbursements, cancellations, prepayments and interest being considered. The Bank’s EAD combines actual and contractual cash flows and models future disbursements and repayments based on the Bank’s own experience.
Sensitivity analysis
The sensitivity of portfolio provisions at 31 December 2018 to the key variables used in determining the level of impairment is provided below.
| Adjusted risk parameter | Recalculated provision €million | Change in provision €million | Change in provision % |
| 2018 portfolio provision (Stages 1 and 2) | 306 | – | – |
| Staging 31 | |||
| All loans in Stage 1 | 236 | (70) | (23%) |
| All loans in Stage 2 | 786 | 480 | 157% |
| PD Ratings32 | |||
| All loans upgraded 1 notch | 179 | (127) | (42%) |
| All loans downgraded 1 notch | 513 | 207 | 67% |
| All loans upgraded 3 notches | 57 | (249) | (81%) |
| All loans downgraded 3 notches | 1,391 | 1,085 | 354% |
| Projected GDP33 | |||
| Projected GDP increased by 1% | 286 | (20) | (7%) |
| Projected GDP decreased by 1% | 330 | 24 | 8% |
| Projected GDP increased by 5% | 236 | (70) | (23%) |
| Projected GDP decreased by 5% | 450 | 144 | 47% |
| LGD | |||
| All loans decreased by 10% | 227 | (79) | (26%) |
| All loans increased by 10% | 386 | 80 | 26% |
| EAD | |||
| All undrawn commitments cancelled | 260 | (46) | (15%) |
| All undrawn commitments disbursed within one month | 355 | 49 | 16% |
| PD rates – weighting of Bank data and external data | |||
| Increase weighting of Bank data by 10% | 269 | (37) | (12%) |
| Decrease weighting of Bank data by 10% | 343 | 37 | 12% |
With respect to specific provisions, an increase or decrease of 10 percentage points on the current provision cover level would have an impact of ±€99 million (2017: €85 million).
Judgements not involving estimation
In the process of applying its accounting policies, the Bank makes various judgements in addition to those involving estimation that can significantly affect the amounts recognised in the financial statements. These judgements are described in detail in the accounting policies section.
Risk management
Financial risks
Risk governance
The Bank’s overall framework for identification and management of risks is underpinned by independent second line of defence34 control functions, including the Risk Management department, Office of the Chief Compliance Officer, Environmental and Social Department, Finance Department, Evaluation Department and other relevant units. An Internal Audit Department acts as third line of defence and independently assesses the effectiveness of the processes within the first and second lines of defence. The Vice President, Risk and Compliance and Chief Risk Officer (CRO) is responsible for ensuring the independent risk management of the Banking and Treasury exposures, including adequate processes and governance structure for independent identification, measurement, monitoring and mitigation of risks incurred by the Bank. The challenge of the control functions, review of their status and assessment of their ability to perform duties independently falls within the remit of the Audit Committee of the Board.
Matters related to Bank-wide risk and associated policies and procedures are considered by the Risk Committee. The Risk Committee is chaired by the Vice President, Risk and Compliance, CRO. The Risk Committee is accountable to the President. It oversees all aspects of the Banking and Treasury portfolios across all sectors and countries, and provides advice on risk management policies, measures and controls. It also approves proposals for new products submitted by Banking or Treasury. The membership comprises senior managers across the Bank including representatives from Risk Management, Finance, Banking and the Office of the General Counsel.
The Managing Director, Risk Management reports to the Vice President, Risk and Compliance, CRO and leads the overall management of the department. Risk Management provides an independent assessment of risks associated with individual investments undertaken by the Bank, and performs an ongoing review of the portfolio to monitor credit, market and liquidity risks and to identify appropriate risk management actions. It also assesses and proposes ways to manage risks arising from correlations and concentrations within the portfolio, and ensures that adequate systems and controls are put in place for identification and management of operational risks across the Bank. It develops and maintains the risk management policies to facilitate Banking and Treasury operations and promotes risk awareness across the Bank.
In exercising its responsibilities, Risk Management is guided by its mission to:
- provide assurance to stakeholders that risk decision-making in the Bank is balanced and within agreed appetite, and that control processes are rigorously designed and applied
- support the Bank’s business strategy including the maximisation of transition impact through provision of efficient and effective delivery of risk management advice, challenge and decision-making.
Risks in 2019
Below is a summary of current top and emerging risks identified by the Bank. These are risks that, if they were to crystallise, have
the potential to negatively affect the Bank’s ability to carry out its mandate and/or which would cause a material deterioration in its portfolio. These risks therefore provide a background to understanding the changes in the Bank’s risk profile and exposures and are closely monitored by management.
- Further increase in prominence of parties and policies with “national (inward)” focus leading to progressive fragmentation of global economy and hence increasing the challenge of delivering on transition and the Bank’s mission overall.
- Global cyclical economic slowdown, putting pressure on credit availability and export revenues in the economies where the Bank invests and adversely impacting valuations and credit risk in the Bank’s portfolio.
- Sharp capital outflows from several economies where the Bank invests, which could lead to exchange rates shifts, increased costs of borrowing, as well as substantial drop in equity prices. This would likely pose new challenges for the Bank’s clients, increase credit risk and materially decrease the value and liquidity of the Bank’s equity investments, resulting in financial losses and reduction in the
Bank’s capital. - Escalation of instability and/or regional conflict in the southern and eastern Mediterranean region (SEMED), with spillover effects on other parts of the region, leading to increased political risks and a deteriorating business environment.
- Material reform slowdown in one or more of the Bank’s key markets (Turkey, Egypt, Poland, Ukraine and Kazakhstan), reducing the scope for the Bank’s engagement in pursuing its mandate.
In carrying out its mission, the Bank is exposed to financial risks through both its Banking and Treasury activities. These are principally credit, market, operational and liquidity risks.
A. Credit risk
Credit risk is the potential loss to a portfolio that could result from either the default of a counterparty or the deterioration of its creditworthiness. The Bank is also exposed to concentration risk, which arises from too high a proportion of the exposure being exposed to a single obligor and/or exposure that has the potential to simultaneously deteriorate due to correlation to an event. Exposure to obligors in the same country or sector are examples but such concentrations could also include clusters or subsets of country or sector portfolios.
The Bank is exposed to credit risk in both its Banking and Treasury activities, as Banking and Treasury counterparties could default on their contractual obligations, or the value of the Bank’s investments could become impaired. The Bank’s maximum exposure to credit risk from financial instruments is approximated on the balance sheet, inclusive of the undrawn commitments related to loans and guarantees (see note 27).
Details of collateral and other forms of risk reduction are provided within the respective sections on Banking and Treasury below.
Credit risk in the Banking portfolio: Management
Individual projects
The Board of Directors approves the principles underlying the credit process for the approval, management and review of Banking exposures. The Audit Committee periodically reviews these principles and its review is submitted to the Board.
The Operations Committee reviews all Banking projects (both debt and equity transactions) prior to their submission for Board approval. The Committee is chaired by the First Vice President and Head of Client Services Group and its membership comprises senior managers of the Bank, including the Vice President, Risk and Compliance, CRO and the Managing Director, Risk Management. A number of frameworks for smaller projects are considered by the Small Business Investment Committee or by senior management under a delegated authority framework supervised by the Operations Committee. The project approval process is designed to ensure compliance with the Bank’s criteria for sound banking, transition impact and additionality.35 It operates within the authority delegated by the Board, via the President, to approve projects within Board-approved framework operations. The Operations Committee is also responsible for approving significant changes to existing operations.
The Equity Committee acts as the governance committee for the equity portfolio and reports to the Operations Committee. Risk Management is represented at both the Equity Committee and the Small Business Investment Committee.
Risk Management conducts reviews of all exposures within the Banking portfolio. At each review, Risk Management assesses whether there has been any change in the risk profile of the exposure, recommends actions to mitigate risk and reconfirms or adjusts the risk rating. It also reviews the fair value of equity investments.
Portfolio level review
Risk Management reports on the development of the portfolio as a whole on a quarterly basis to senior management and the Board. The report includes a summary of key factors affecting the portfolio and provides analysis and commentary on trends within the portfolio and various sub-portfolios. It also includes reporting on compliance with portfolio risk limits.
To identify emerging risk and enable appropriate risk mitigating actions Risk Management also conducts regular Bank-wide (top-down) and regional (bottom-up) stress testing exercises and comprehensive reviews of its investment portfolios. The Bank recognises that any resulting risk mitigation is constrained by the limited geographical space within which the Bank operates.
EBRD internal ratings
Probability of default ratings (PD ratings)
The Bank assigns its internal risk ratings to all counterparties, including borrowers, investee companies, guarantors, put counterparties and sovereigns in the Banking and Treasury portfolios. Risk ratings reflect the financial strength of the counterparty as well as consideration of any implicit support, for example from a major shareholder. The sovereign rating takes into consideration the ratings assigned by external rating agencies. For sovereign risk projects, the overall rating is the same as the sovereign rating. For non‑sovereign operations, probability of default ratings are normally capped by the sovereign rating, except where the Bank has recourse to a guarantor from outside the country which may have a better rating than the local sovereign rating.
The table below shows the Bank’s internal probability of default rating scale from 1.0 (lowest risk) to 8.0 (highest risk) and how this maps to the external ratings of Standard & Poor’s (S&P). References to risk rating through this text relate to probability of default ratings unless otherwise specified.36
Loss given default
The Bank assigns loss given default percentages on a scale of 3 to 100 determined by the seniority of the instrument in which the Bank invested.37
Non-performing loans (NPL)
NPL definition
An asset is designated as non-performing when either the borrower is past due on payment to any material creditor for 90 days or more, or when Risk Management considers that the counterparty is unlikely to pay its credit obligations in full without recourse by the Bank to actions such as realising security, if held.38
Provisioning methodology
A specific provision is raised on all NPL accounted for at amortised cost. The provision represents the amount of anticipated loss, being the difference between the outstanding amount from the client and the expected recovery amount. The expected recovery amount is equal to the present value of the estimated future cash flows discounted at the loan’s original effective interest rate. For loans held at fair value through either profit and loss or other comprehensive income, the fair value of the loan equates to the expected recovery amount thus calculated.
General portfolio provisions
In the performing portfolio, provisions are held against expected credit losses. These amounts are based on the PD rates associated with the rating assigned to each counterparty, the LGD parameters reflecting product seniority, the effective interest rate of the loan and the exposure at default.
Credit risk in the Banking portfolio: 2018
Total Banking loan exposure (operating assets including fair value adjustments but before provisions) increased during the year from €23.0 billion at 31 December 2017 to €24.6 billion at 31 December 2018. The total signed Banking loan portfolio and guarantees increased from €34.5 billion at 31 December 2017 to €36.3 billion at 31 December 2018.
The average credit profile of the portfolio worsened slightly in 2018 as the weighted average probability of default (WAPD) rating increased
to 5.74 (2017: 5.67). This performance largely reflected a slight deterioration in the economic and political environment in the economies where the Bank invests, with the sovereign downgrade in Turkey especially significant. Risk range 7 loans (those risk rated 6.7 to 7.3) decreased from 14.0 to 12.3 per cent and the absolute level now stands at €4.5 billion (2017: €4.9 billion). The reduction in this portfolio was driven by repayments in Eastern Europe and the Caucasus.
NPL39 increased over 2018, amounting to €1.2 billion or 4.7 per cent of operating assets at year-end 2018 (2017: €0.9 billion or 3.9 per cent). Distressed restructured loans40 were relatively low, comprising an additional €526 million or 2.1 per cent of operating
assets at year-end 2018 (2017: €727 million or 3.1 per cent). Net write-offs amounted to €107 million in 2018 (2017: €135 million).
Specific provisions also increased in 2018, reflecting weakening of the macro-financial environment in the economies in which the Bank invests, particularly Turkey.
| Movement in NPL41 | 2018 € million | 2017 € million |
| Opening balance | 898 | 1,292 |
| Repayments | (144) | (315) |
| Write-offs | (107) | (135) |
| New impaired assets | 515 | 119 |
| Other movements | 14 | (63) |
| Closing balance | 1,176 | 898 |
| Movement in specific provisions42 | 2018 € million | 2017 € million |
| Opening balance | 602 | 765 |
| Provision cover | 71% | 63% |
| New/increased specific provisions | 252 | 122 |
| Provisions release – repayments | (79) | (90) |
| Provisions release – now performing | – | (19) |
| Provisions release – write-offs | (91) | (115) |
| Foreign exchange movement | 12 | (46) |
| Unwinding discount43 | (21) | (15) |
| Closing balance | 675 | 602 |
| Provision cover44 | 59% | 71% |
Loan investments at amortised cost
For the purpose of calculating impairment in accordance with IFRS 9, loans at amortised cost are grouped in three stages.45
- Stage 1: Loans are originated in Stage 1. In this stage impairment is calculated on a portfolio basis and equates to the expected credit loss from these assets over a 12-month horizon.
- Stage 2: Loans for which there has been a significant increase in credit risk since inception, but which are still performing loans are grouped in Stage 2. In this stage impairment is calculated on a portfolio basis and equates to the full life expected credit loss from these assets.
- Stage 3: Loans for which there is specific evidence of impairment are grouped in Stage 3. In this stage the lifetime expected credit loss is specifically calculated for each individual asset.
Set out below is an analysis of the Banking loan investments and the associated impairment provisions for each of the Bank’s internal risk rating categories. 2017 comparatives are presented in accordance with IAS 39 and hence there is no presentation of loan stages.
| Amortised cost carrying value | Impairment | Total net of impairment | ||||||||
| Risk rating category | Stage 1 € million | Stage 2 € million | Credit Impaired Stage 3 € million | Total € million | Total % | Stage 1 € million | Stage 2 € million | Credit Impaired Stage 3 € million | Total net of impairment € million | Impairment provisions coverage % |
| 2: Very strong | – | 2 | – | 2 | – | – | – | – | 2 | – |
| 3: Strong | 478 | 34 | – | 512 | 2.3 | – | – | – | 512 | – |
| 4: Good | 1,844 | 107 | – | 1,951 | 8.7 | (1) | (2) | – | 1,948 | 0.2 |
| 5: Fair | 4,660 | 448 | – | 5,108 | 22.8 | (7) | (2) | – | 5,099 | 0.2 |
| 6: Weak | 10,283 | 700 | – | 10,983 | 49 | (100) | (15) | – | 10,868 | 1 |
| 7: Special attention | 1,979 | 743 | – | 2,722 | 12.1 | (85) | (94) | – | 2,543 | 6.6 |
| 8: Non-performing 46 | – | – | 1,135 | 1,135 | 5.1 | – | – | (675) | 460 | 59.5 |
| At 31 December 2018 | 19,244 | 2,034 | 1,135 | 22,413 | 100 | -193 | -113 | (675) | 21,432 | |
| Risk rating category | Neither past due nor impaired € million | Past due but not impaired € million | Impaired € million | Total € million | Total % | Portfolio provisions for unidentified impairment € million | Specific provisions for identified impairment € million | Total net of impairment € million | Impairment provisions coverage % |
| 2: Very strong | 3 | – | – | 3 | – | – | – | 3 | – |
| 3: Strong | 338 | – | – | 338 | 1.5 | – | – | 338 | – |
| 4: Good | 2,571 | – | – | 2,571 | 11.4 | (2) | – | 2,569 | 0.1 |
| 5: Fair | 7,404 | 99 | – | 7,503 | 33.2 | (9) | – | 7,494 | 0.1 |
| 6: Weak | 8,402 | 3 | – | 8,405 | 37.1 | (87) | – | 8,318 | 1 |
| 7: Special attention | 2,933 | 29 | – | 2,962 | 13.1 | (150) | – | 2,812 | 5.1 |
| 8: Non-performing | – | – | 848 | 848 | 3.7 | – | (602) | 246 | 71 |
| At 31 December 2017 | 21,651 | 131 | 848 | 22,630 | 100 | (248) | (602) | 21,780 |
At the end of 2018, €66 million of loans were past due but not impaired (2017: €131 million). Loans amounting to €33 million were past due for 30 days or less (2017: €120 million), and €33 million were past due for more than 30 days but less than 90 days (2017: €11 million).
At 31 December 2018 the Bank had security arrangements in place for €7.7 billion of its loan operating assets (2017: €7.2 billion). Although this security is generally illiquid and its value is closely linked to the performance of the relevant loan operating assets, it does provide the Bank with rights and negotiating leverage that help mitigate overall credit risk. The Bank also benefited from guarantees and risk-sharing facilities extended by Special Funds and Cooperation Funds (see note 30: related parties) which provided credit enhancement of approximately €91 million at the year-end (2017: €90 million).
Loans at fair value through profit or loss
Set out below is an analysis of the Bank’s loans held at fair value through profit or loss for each of the Bank’s relevant internal risk rating categories.
| Risk rating category | Fair value 2018 € million | Fair value 2017 € million |
| 5: Fair | 13 | 72 |
| 6: Weak | 236 | 189 |
| 7: Special attention | 211 | 106 |
| 8: Non-performing | – | 5 |
| At 31 December | 460 | 372 |
Loans at fair value through other comprehensive income47
Set out below is an analysis of the Bank’s loans held at fair value through other comprehensive income for each of the Bank’s relevant internal risk rating categories.
| Risk rating category | Fair value 2018 € million | Fair value 2017 € million |
| 3: Strong | 60 | – |
| 4: Good | 567 | – |
| 5: Fair | 568 | – |
| 6: Weak | 483 | – |
| 7: Special attention | 59 | – |
| At 31 December | 1,737 | – |
Undrawn commitments and guarantees
Set out below is an analysis of the Bank’s undrawn loan commitments and guarantees for each of the Bank’s relevant internal risk rating categories.
| Risk rating category | Undrawn loan commitments 2018 € million | Guarantees 2018 € million | Undrawn loan commitments 2017 € million | Guarantees 2017 € million |
| 3: Strong | 76 | – | 104 | – |
| 4: Good | 1,104 | 8 | 1,265 | 8 |
| 5: Fair | 2,128 | 63 | 3,008 | 90 |
| 6: Weak | 6,240 | 621 | 4,897 | 339 |
| 7: Special attention | 1,245 | 196 | 1,410 | 338 |
| 8: Non-performing | 9 | – | 8 | 20 |
| At 31 December | 10,802 | 888 | 10,692 | 795 |
The Bank would typically have conditions precedent that would need to be satisfied before further disbursements on its debt transactions. In addition, for projects risk rated 8, it is unlikely that commitments would be drawn down without additional assurances that credit quality would improve.
Credit risk in the Banking portfolio: Concentration
Concentration by country
The following table breaks down the main Banking credit risk exposures in their carrying amounts by country. The Bank is generally well diversified by country apart from its concentration in Turkey and Ukraine which account for 20.0 and 7.1 per cent of loans drawn down respectively (as shown below) and 15.9 and 9.4 per cent of the Bank’s total loans including undrawn respectively. However, by the nature of the regional focus of the Bank’s business model, some groups of countries in which the Bank operates are highly correlated.
| Country | Loans 2018 € million | Undrawn loan commitments and guarantees 2018 € million | Total 2018 € million | Loans 2017 € million | Undrawn loan commitments and guarantees 2017 € million | Total 2017 € million |
| Albania | 401 | 231 | 632 | 134 | 278 | 412 |
| Armenia | 163 | 73 | 236 | 154 | 54 | 208 |
| Azerbaijan | 998 | 388 | 1,386 | 671 | 478 | 1,149 |
| Belarus | 404 | 236 | 640 | 346 | 108 | 454 |
| Bosnia and Herzegovina | 537 | 493 | 1,030 | 542 | 474 | 1,016 |
| Bulgaria | 823 | 135 | 958 | 772 | 123 | 895 |
| Croatia | 653 | 171 | 824 | 727 | 164 | 891 |
| Cyprus | 15 | 66 | 81 | 14 | 50 | 64 |
| Czech Republic | 2 | – | 2 | 3 | – | 3 |
| Egypt | 1,415 | 1,911 | 3,326 | 845 | 1,611 | 2,456 |
| Estonia | 85 | – | 85 | 65 | – | 65 |
| FYR Macedonia48 | 260 | 511 | 771 | 236 | 455 | 691 |
| Georgia | 683 | 130 | 813 | 619 | 79 | 698 |
| Greece | 993 | 377 | 1,370 | 697 | 182 | 879 |
| Hungary | 385 | – | 385 | 341 | 39 | 380 |
| Jordan | 654 | 302 | 956 | 443 | 284 | 727 |
| Kazakhstan | 1,509 | 735 | 2,244 | 1,601 | 811 | 2,412 |
| Kosovo | 82 | 177 | 259 | 52 | 167 | 219 |
| Kyrgyz Republic | 103 | 78 | 181 | 135 | 116 | 251 |
| Latvia | 88 | 2 | 90 | 92 | 2 | 94 |
| Lebanon | 130 | 60 | 190 | – | – | – |
| Lithuania | 142 | 23 | 165 | 76 | 43 | 119 |
| Moldova | 134 | 365 | 499 | 125 | 442 | 567 |
| Mongolia | 702 | 47 | 749 | 699 | 80 | 779 |
| Montenegro | 243 | 97 | 340 | 227 | 120 | 347 |
| Morocco | 438 | 453 | 891 | 402 | 439 | 841 |
| Poland | 1,723 | 282 | 2,005 | 1,768 | 287 | 2,055 |
| Romania | 1,179 | 272 | 1,451 | 1,101 | 273 | 1,374 |
| Russian Federation | 537 | 25 | 562 | 1,081 | 44 | 1,125 |
| Serbia | 1,399 | 531 | 1,930 | 1,252 | 750 | 2,002 |
| Slovak Republic | 305 | 114 | 419 | 220 | 142 | 362 |
| Slovenia | 148 | 23 | 171 | 168 | 41 | 209 |
| Tajikistan | 137 | 241 | 378 | 110 | 219 | 329 |
| Tunisia | 313 | 221 | 534 | 241 | 241 | 482 |
| Turkey | 4,970 | 863 | 5,833 | 5,070 | 1,072 | 6,142 |
| Turkmenistan | 29 | 14 | 43 | 39 | 11 | 50 |
| Ukraine | 1,726 | 1,673 | 3,399 | 1,925 | 1,744 | 3,669 |
| Uzbekistan | 102 | 370 | 472 | 9 | 64 | 73 |
| At 31 December | 24,610 | 11,690 | 36,300 | 23,002 | 11,487 | 34,489 |
Concentration by industry sector
The following table breaks down the main Banking credit exposures in their carrying amounts by the industry sector of the project. The portfolio is generally well diversified with only transport, power and energy as well as depository credit (banks) constituting substantial sector concentrations.
| Loans 2018 € million | Undrawn loan commitments and guarantees 2018 € million | Total 2018 € million | Loans 2017 € million | Undrawn loan commitments and guarantees 2017 € million | Total 2017 € million | |
| Agribusiness | 2,018 | 293 | 2,311 | 1,909 | 496 | 2,405 |
| Depository credit (banks) | 5,337 | 1,195 | 6,532 | 4,687 | 1,230 | 5,917 |
| Information and communication technologies | 546 | 20 | 566 | 611 | 6 | 617 |
| Insurance, pension, mutual funds | 74 | 2 | 76 | 101 | 1 | 102 |
| Leasing finance | 617 | 31 | 648 | 540 | 74 | 614 |
| Manufacturing and services | 2,425 | 448 | 2,873 | 2,226 | 412 | 2,638 |
| Municipal and environmental infrastructure | 1,964 | 2,770 | 4,734 | 1,651 | 1,105 | 2,756 |
| Natural resources | 2,690 | 1,111 | 3,801 | 1,902 | 499 | 2,401 |
| Non-depository credit (non-bank) | 553 | 114 | 667 | 172 | 50 | 222 |
| Power and energy | 4,211 | 2,084 | 6,295 | 2,910 | 1,067 | 3,977 |
| Property and tourism | 535 | 32 | 567 | 436 | 52 | 488 |
| Transport | 3,640 | 3,590 | 7,230 | 1,755 | 310 | 2,065 |
| Non-sovereign | 20,233 | 4,985 | 25,218 | 18,900 | 5,302 | 24,202 |
| Sovereign | 4,377 | 6,705 | 11,082 | 4,102 | 6,185 | 10,287 |
| At 31 December | 24,610 | 11,690 | 36,300 | 23,002 | 11,487 | 34,489 |
Concentration by counterparty
The Bank has maximum nominal as well as risk-based non-sovereign Banking counterparty exposure limits. Maximum exposure (after risk transfers) to a non-sovereign economic group was €569 million at end-2018 (2017: €852 million).
Credit risk in Treasury: Management
Key risk parameters for funding, cash management, asset and liability management and liquidity risk appetite are approved by the Board of Directors and articulated in the Treasury Authority and Liquidity Policy (TALP). The TALP is the document by which the Board of Directors delegates authority to the Senior Vice President, Chief Financial Officer and Chief Operating Officer to manage and the Vice President Risk and Compliance, CRO to identify, measure, monitor and mitigate the Bank’s Treasury exposures. The TALP covers all aspects of Treasury activities where financial risks arise and also Risk Management’s identification, measurement, management and mitigation of those risks. In addition, Treasury Authority and Liquidity Procedures are approved by the Vice President Risk and Compliance, CRO to regulate operational aspects of Treasury risk-taking and the related risk management processes and procedures.
Eligible Treasury counterparties and investments are normally internally rated between 1.0 and 4.0 (approximately equivalent to S&P AAA to BBB ratings), with the exception of counterparties approved for local currency activities in the economies where the Bank invests. These activities support the Bank’s initiatives to provide local currency financing to Banking clients and to develop local capital markets. In cases where the creditworthiness of an issuer or counterparty deteriorates to levels below the eligibility standard for existing exposures, Risk Management and Treasury recommend actions for the approval of the Vice President Risk and Compliance, CRO and the Senior Vice President, Chief Financial Officer and Chief Operating Officer.
The Treasury Authority and Liquidity Procedures state the minimum internal credit rating and maximum tenor by type of eligible counterparty and set the maximum credit limits per rating. The actual credit limit and/or tenor approved for individual counterparties by Risk Management may be smaller or shorter than the ceilings defined by the Treasury Authority and Liquidity Procedures based on the likely direction of creditworthiness over the medium term, or on sector considerations. The limits apply across the range of eligible Treasury products for approved counterparties with exposures measured on a risk-adjusted basis. All individual counterparty and investment credit lines are monitored and reviewed by Risk Management at least annually.
The Bank’s exposure measurement methodology for Treasury credit risk uses a Monte Carlo simulation technique that produces, to a high degree of confidence, maximum exposure amounts at future points in time for each counterparty. This includes all transaction types and is measured out to the maturity of the longest dated transaction with each respective counterparty. These potential future exposures (PFE) are calculated and controlled against approved credit limits on a daily basis with exceptions escalated to the relevant authority level for approval. Further, the overall credit risk incurred by the Bank in its Treasury transactions is subject to a Default Value-at-risk (DVaR)49 limit of 10 per cent of the Bank’s available capital.
Risk mitigation techniques (such as netting and collateral) and risk transfer instruments reduce calculated credit exposure. For example, an ISDA Credit Support Annex (CSA) to underpin over-the-counter (OTC) derivatives activity reduce PFE/DVaR in line with collateral posting expectations.
Credit risk in Treasury: Treasury liquid assets
The carrying value of Treasury’s liquid assets stood at €29.0 billion at 31 December 2018 (2017: €25.0 billion).50
The internal ratings of Treasury’s counterparties and sovereign exposures are reviewed at least annually and adjusted as appropriate. Overall the WAPD rating, weighted by the carrying value of Treasury’s liquid assets, improved to 2.30 at 31 December 2018 (2017: 2.32).
Placements with and advances to credit institutions
Set out below is an analysis of the Bank’s placements with and advances to credit institutions for each of the Bank’s relevant internal risk rating categories.
| Risk rating category | 2018 € million | 2017 € million |
| 1: Excellent | – | 287 |
| 2: Very strong | 4,843 | 3,003 |
| 3: Strong | 10,213 | 10,256 |
| 4: Good | 693 | 649 |
| 5: Fair | 237 | 372 |
| 6: Weak | 15 | 32 |
| 7: Special attention | 13 | 6 |
| At 31 December | 16,014 | 14,605 |
Debt securities at fair value through profit or loss
Set out below is an analysis of the Bank’s debt securities at fair value through profit or loss for each of the Bank’s relevant internal risk rating categories.
| Risk rating category | 2018 € million | 2017 € million |
| 1: Excellent | 630 | 397 |
| 2: Very strong | 323 | 112 |
| 3: Strong | 175 | 141 |
| 4: Good | 177 | 198 |
| 5: Fair | 33 | 15 |
| 6: Weak | 266 | 53 |
| At 31 December | 1,604 | 916 |
Debt securities at amortised cost
Set out below is an analysis of the Bank’s debt securities at amortised cost for each of the Bank’s relevant internal risk rating categories.
| Risk rating category | 2018 € million | 2017 € million |
| 1: Excellent | 5,812 | 5,054 |
| 2: Very strong | 3,826 | 2,914 |
| 3: Strong | 1,705 | 1,497 |
| At 31 December | 11,343 | 9,465 |
Treasury credit risk exposure
In addition to Treasury’s liquid assets there are other products such as OTC swaps and forward contracts that are included within Treasury’s overall portfolio. PFE calculations show the future exposure throughout the life of a transaction or, in the case of collateralised portfolios, over the appropriate unwind periods. This is particularly important for Treasury’s repurchase/reverse repurchase activity and hedging products such as OTC swaps and forwards. Calculation of PFE takes into account reduction in counterparty exposures through standard risk mitigations such as netting and collateral, which enables Risk Management to see a comprehensive exposure profile for all Treasury products (including liquid assets) against a specific counterparty limit on a daily basis. Whereas PFE measures the exposure at default, DVaR calculations are based on a simulation of counterparty defaults. DVaR measures the maximum aggregated loss, to a high degree of confidence (99.99%), that Treasury could incur over a one-year horizon due to defaults.
Treasury PFE stood at €27.1 billion at 31 December 2018 (2017: €22.3 billion), whereas the DVaR was €1.1 billion at 31 December 2018 (2017: €0.9 billion).
Treasury maintained a high-quality average credit risk profile during 2018 by investing liquidity in AAA sovereign and other highly rated assets. This was reflected in a high and stable WAPD rating of the portfolio, as measured by PFE, which was 2.24 at 31 December 2018 (2017: 2.23).
A very low proportion of Treasury exposures was below investment grade quality,51 amounting to around 2.4 per cent at 31 December 2018 (2017: 2.3 per cent). This comprised a small pool of local currency assets held with counterparties from the economies in which the Bank invests.
Derivatives
The Bank makes use of derivatives for different purposes within both its Banking portfolio and its Treasury activities. Within the Banking equity portfolio option contracts are privately negotiated with third parties to provide potential exit routes for the Bank on many of its unlisted share investments. Banking also has a portfolio of interest rate swaps with clients to hedge its market risks. Furthermore, Banking has a small number of currency swaps that are fully hedged and have been entered into with clients to assist them in the management of their market risks. Within Treasury, the use of exchange-traded and OTC derivatives is primarily focused on hedging interest rate and foreign exchange risks arising from Bank-wide activities. Market views expressed through derivatives are also undertaken as part of Treasury’s activities (within the tight market risk limits described here), while the transactions through which the Bank funds itself in the capital markets are typically swapped into floating-rate debt with derivatives.
The risks arising from derivative instruments are combined with those deriving from all other instruments dependent on the same underlying risk factors, and are subject to overall market and credit risk limits, as well as to stress tests. Additionally, special care is devoted to those risks that are specific to the use of derivatives through, for example, the monitoring of volatility risk for options.
The table below shows the fair value of the Bank’s derivative financial assets and liabilities at 31 December 2018 and 31 December 2017.
| Assets 2018 € million | Liabilities 2018 € million | Total 2018 € million | Assets 2017 € million | Liabilities 2017 € million | Total 2017 € million |
|
| Portfolio derivatives not designated as hedges | ||||||
| OTC foreign currency products | ||||||
| Currency swaps | 287 | (74) | 213 | 181 | (91) | 90 |
| Spot and forward currency transactions | 134 | (69) | 65 | 70 | (148) | (78) |
| 421 | (143) | 278 | 251 | (239) | 12 | |
| OTC interest rate products | ||||||
| Interest rate swaps | 103 | (157) | (54) | 79 | (152) | (73) |
| OTC credit products | ||||||
| Credit default swaps | – | – | – | – | (1) | (1) |
| Banking derivatives | ||||||
| Fair value of equity derivatives held in relation to the Banking portfolio | 499 | (99) | 400 | 455 | (77) | 378 |
| Total portfolio derivatives not designated as hedges and Banking derivatives | 1,023 | (399) | 624 | 785 | (469) | 316 |
| Derivatives held for hedging | ||||||
| Derivatives designated as fair value hedges | ||||||
| Interest rate swaps | 1,042 | (312) | 730 | 1,092 | (259) | 833 |
| Cross currency interest rate swaps | 1,278 | (1,220) | 58 | 1,361 | (980) | 381 |
| Embedded derivatives52 | 603 | (148) | 455 | 438 | (116) | 322 |
| 2,923 | (1,680) | 1,243 | 2,891 | (1,355) | 1,536 | |
| Derivatives designated as cash flow hedges | ||||||
| Forward currency transactions | 2 | – | 2 | 1 | – | 1 |
| Total derivatives held for hedging | 2,925 | (1,680) | 1,245 | 2,892 | (1,355) | 1,537 |
| Total derivatives at 31 December | 3,948 | (2,079) | 1,869 | 3,677 | (1,824) | 1,853 |
Set out below is an analysis of the Bank’s derivative financial assets for each of the Bank’s internal risk rating categories.
| Risk rating category | 2018 € million | 2017 € million |
| 1: Excellent | 604 | 438 |
| 2: Very strong | 1,965 | 1,234 |
| 3: Strong | 813 | 1,489 |
| 4: Good | 173 | 150 |
| 5: Fair | 195 | 301 |
| 6: Weak | 176 | 15 |
| 7: Special attention | 22 | 50 |
| At 31 December | 3,948 | 3,677 |
Included in the fair value of derivatives is a net valuation increase of €40 million attributable to the counterparty portfolio‑level adjustments for CVA/DVA/FVA (2017: €43 million). The valuation adjustments may be analysed thus:
- CVA: the credit valuation adjustment which reflects the impact on the price of a derivative trade from changes in the credit risk associated with the counterparty; €10 million (2017: €11 million).
- DVA: the debit valuation adjustment which reflects the impact on the price of a derivative trade from changes in the credit risk associated with the EBRD; €(12) million (2017: €(6) million).
- FVA: the funding valuation adjustment which reflects the costs and benefits arising when uncollateralised derivative exposures are hedged with collateralised trades; €42 million (2017: €38 million).
Also included in the valuation of derivatives is an overall negative value to the Bank of €6 million attributable to “cheapest-to-deliver” (CTD) adjustments (2017: €18 million) reflecting the value of terms and conditions relating to the posting of collateral in the Bank’s CSA agreements.
In order to manage credit risk in OTC derivative transactions,53 the Bank’s policy is to approve, in advance, each counterparty individually and to review its creditworthiness and eligibility regularly. Derivatives limits are included in overall counterparty credit limits. OTC derivative transactions are normally carried out only with the most creditworthy counterparties, rated at the internal equivalent of BBB and above. Furthermore, the Bank pays great attention to mitigating the credit risk of OTC derivatives through the negotiation of appropriate legal documentation with counterparties. OTC derivative transactions are documented under an ISDA Master Agreement within an accompanying CSA. These provide for close-out netting and the posting of collateral by the counterparty once the Bank’s exposure exceeds a given threshold, which is usually a function of the counterparty’s risk rating.
The Bank has also expanded the scope for applying risk mitigation techniques by documenting the widest possible range of instruments transacted with a given counterparty under a single Master Agreement and CSA, notably foreign exchange transactions. Similarly, the Bank emphasises risk mitigation for repurchase and reverse repurchase agreements and related transaction types through Master Agreement documentation.
Collateral
The Bank mitigates counterparty credit risk by holding collateral against exposures to derivative counterparties.
Counterparty exposure, for the purposes of collateralising credit risk, is only concerned with counterparties with whom the Bank has an overall net positive exposure. At 31 December 2018 this exposure stood at €1.3 billion (2017: €1.4 billion). Against this, the Bank held collateral of €1.3 billion (2017: €1.4 billion), reducing its net credit exposure to €nil (2017: €nil).
Where the Bank borrows or purchases securities subject to a commitment to resell them (a reverse repurchase agreement) but does not acquire the risk and rewards of ownership, the transactions are treated as collateralised loans. The securities are not included in the balance sheet and are held as collateral.
The table below illustrates the fair value of collateral held that is permitted to be sold or repledged in the absence of default. Sold or repledged collateral includes collateral on-lent through bond lending activities. In all cases the Bank has an obligation to return equivalent securities.
| Collateral held as security | Held collateral 2018 € million | Sold or repledged 2018 € million | Held collateral 2017 € million | Sold or repledged 2017 € million |
| Derivative financial instruments | ||||
| High grade government securities | 347 | – | 60 | – |
| Cash | 910 | 910 | 1,358 | 1,358 |
| 1,257 | 910 | 1,418 | 1,358 | |
| Reverse sale and repurchase transactions | 3,111 | 46 | 3,828 | 34 |
| At 31 December | 4,368 | 956 | 5,246 | 1,392 |
Where the Bank sells securities subject to a commitment to repurchase them (a repurchase agreement) but does not transfer the risk and rewards of ownership, the transactions are treated as collateralised borrowings. The securities remain included in the balance sheet and are deemed to be held by the counterparty as collateral. The table below shows the carrying amount of collateral that has been pledged by the Bank in connection with its borrowings.
| Collateral pledged as security | Pledged collateral 2018 € million | Pledged collateral 2017 € million |
| Sale and repurchase transactions | 412 | 393 |
The table below shows the reported values of derivatives that are subject to Master Agreement netting arrangements.
| Recognised derivative assets 2018 € million | Recognised derivative liabilities 2018 € million | Net position 2018 € million | Collateral held 2018 € million |
|
| Subject to a master netting agreement | ||||
| Net derivative assets by counterparty | 1,818 | (540) | 1,278 | 1,209 |
| Net derivative liabilities by counterparty | 982 | (1,287) | (305) | 48 |
| 2,800 | (1,827) | 973 | 1,257 | |
| No master netting agreement | ||||
| Other derivatives | 46 | (5) | 41 | – |
| Embedded derivatives | 603 | (148) | 455 | – |
| Equity derivatives | 499 | (99) | 400 | – |
| 1,148 | (252) | 896 | – | |
| At 31 December | 3,948 | (2,079) | 1,869 | 1,257 |
| Recognised derivative assets 2017 € million | Recognised derivative liabilities 2017 € million | Net position 2017 € million | Collateral held 2017 € million |
|
| Subject to a master netting agreement | ||||
| Net derivative assets by counterparty | 1,997 | (593) | 1,404 | 1,392 |
| Net derivative liabilities by counterparty | 751 | (1,028) | (277) | 26 |
| 2,748 | (1,621) | 1,127 | 1,418 | |
| No master netting agreement | ||||
| Other derivatives | 36 | (10) | 26 | – |
| Embedded derivatives | 438 | (116) | 322 | – |
| Equity derivatives | 455 | (77) | 378 | – |
| 929 | (203) | 726 | – | |
| At 31 December | 3,677 | (1,824) | 1,853 | 1,418 |
Credit risk in Treasury: Concentration
Concentration by country
At the end of 2018, Treasury credit risk exposure was spread across the following countries:
Concentration by counterparty type
The Bank continues to be largely exposed to banks in the Treasury portfolio which accounted for 62.4 per cent of the portfolio peak exposure (2017: 62.5 per cent). Direct sovereign exposure54 decreased to 8.2 per cent (2017: 9.0 per cent), while exposure to counterparties in the economies in which the Bank invests remained stable at 4.7 per cent (2017: 5.0 per cent) on a PFE basis.
B. Market risk
Market risk is the potential loss that could result from adverse market movements. The drivers of market risk are: (i) interest rate risk; (ii) foreign exchange risk; (iii) equity risk; and (iv) commodity price risk.
Market risk in the Banking portfolio
The Banking loan portfolio is match-funded by Treasury in terms of currency, so for loan facilities extended in currencies other than the euro the foreign exchange risk is hedged by Treasury. Likewise, interest rate risk to which the Banking loan portfolio would normally be exposed is managed through the Treasury portfolio. As such there is minimal residual foreign exchange or interest rate risk present in the Banking loan portfolio.
The main exposure to market risk in the Banking portfolio arises from the exposure of share investments to foreign exchange and equity price risk, neither of which is captured in the eVaR55 figures discussed under “Market risk in the Treasury portfolio”. Additional sensitivity information for the Bank’s share investments has been included under “fair value hierarchy” later in this section of the report.
The EBRD takes a long-term view of its equity investments, and therefore accepts the short-term volatilities in value arising from exchange rate risk and price risk.
Foreign exchange risk
The Bank is subject to foreign exchange risks as it invests in equities that are denominated in currencies other than the euro. Accordingly, the value of the equity investments may be affected favourably or unfavourably by fluctuations in currency rates. The table below indicates the currencies to which the Bank had significant exposure on its equity investments at 31 December 2018.56 The sensitivity analysis summarises the total effect of a reasonably possible movement of the currency rate57 against the euro on equity fair value and on profit or loss with all other variables held constant.
Share investments at fair value through profit or loss
| 5-year rolling average movement in exchange rate % | Fair value € million | Impact on net profit € million |
|
| Euro | – | 1,865 | – |
| United States dollar | 8.6 | 811 | 70 |
| Russian rouble | 21.2 | 410 | 89 |
| Turkish lira | 17.8 | 349 | 62 |
| Romanian leu | 0.9 | 281 | 2 |
| Polish zloty | 3 | 233 | 7 |
| Ukrainian hryvnia | 27.7 | 160 | 44 |
| Hungarian forint | 2.4 | 110 | 3 |
| Other non-euro | 11.8 | 526 | 62 |
| At 31 December 2018 | 4,745 | 339 |
| 5-year rolling average movement in exchange rate % | Fair value € million | Impact on net profit € million |
|
| Euro | – | 1,815 | – |
| United States dollar | 8.6 | 853 | 74 |
| Russian rouble | 21.2 | 638 | 135 |
| Romanian leu | 1 | 299 | 3 |
| Turkish lira | 16.1 | 288 | 46 |
| Polish zloty | 2.8 | 186 | 5 |
| Ukrainian hryvnia | 28 | 133 | 37 |
| Hungarian forint | 2 | 126 | 3 |
| Other non-euro | 12 | 496 | 60 |
| At 31 December 2017 | 4,834 | 363 |
The average movement in exchange rate for the “other non-euro” consists of the weighted average movement in the exchange rates listed in the same table.
Equity price risk
Equity price risk is the risk of unfavourable changes in the fair values of equities as the result of changes in the levels of equity indices and the value of individual shares. In terms of equity price risk, the Bank expects the effect on net profit will bear a linear relationship to the movement in equity indices, for both listed and unlisted equity investments. The table below summarises the potential impact on the Bank’s net profit from a reasonably possible change in equity indices.58
Share investments at fair value through profit or loss
| 5-year rolling average movement in benchmark index % | Fair value € million | Impact on net profit € million |
||
| Russian Federation | INDEXCFIndex | 14.8 | 713 | 105 |
| Turkey | XU100 Index | 24 | 478 | 115 |
| Romania | BET Index | 10.8 | 359 | 39 |
| Poland | WIG Index | 5.1 | 312 | 16 |
| Ukraine | PFTS Index | 34.6 | 186 | 64 |
| Hungary | BUX Index | 9.3 | 138 | 31 |
| Slovenia | SBTIOP Index | 9.3 | 176 | 17 |
| Serbia | BELEX15 Index | 8.1 | 116 | 9 |
| Regional and other | Weighted average | 16 | 2,267 | 362 |
| At 31 December 2018 | 4,745 | 758 |
| 5-year rolling average movement in benchmark index % | Fair value € million | Impact on net profit € million |
||
| Russian Federation | MICEX Index | 13.5 | 1,074 | 145 |
| Turkey | XU100 Index | 22.5 | 437 | 98 |
| Romania | BET Index | 9.4 | 332 | 31 |
| Poland | WIG Index | 10.5 | 308 | 32 |
| Ukraine | PFTS Index | 20.8 | 166 | 35 |
| Greece | GREK Index | 28 | 152 | 43 |
| Serbia | BELEX15 Index | 9.4 | 102 | 10 |
| Georgia | BGAX Index | 14.1 | 92 | 13 |
| Regional and other | Weighted average | 15.3 | 2,171 | 331 |
| At 31 December 2017 | 4,834 | 738 |
The average movement in benchmark index for “regional and other” is made up of the weighted average movement in benchmark indices of the countries listed in the same table.
Commodity risk in the Banking portfolio
The Bank is exposed to commodity risk through some of its investments and due to the significant importance of commodities in a number
of the economies in which it invests. The aggregate direct exposure to oil and gas extraction, metal ore mining and coal mining (and related support activities) fell to 2.9 per cent (2017: 4.3 per cent) of the overall banking portfolio. This decline in exposure was primarily driven by repayments in Central Asia and Central Europe and the Baltic states. Although the share of this portfolio is a small percentage of the total, the potential overall risk can be more substantial, as several economies in which the Bank invests, most notably Azerbaijan, Kazakhstan, Mongolia and Russia, are heavily reliant on commodity exports to support their economic growth, domestic demand and budgetary revenues. A prolonged and material decline in oil prices would have an adverse effect on hydrocarbon producers and processors, as well as on the relevant sovereigns and corporate clients reliant on domestic demand. The Bank monitors this risk carefully and incorporates oil price movements into its stress testing exercises.
Market risk in the Treasury portfolio
Interest rate and foreign exchange risk
The Bank’s market risk exposure arises from the fact that the movement of interest rates and foreign exchange rates may have an impact on positions taken by the Bank. These risks are centralised and hedged by the Asset and Liability Management desk in Treasury.
Interest rate risk is the risk that the value of a financial instrument will fluctuate due to changes in market interest rates. The length of time for which the interest is fixed on a financial instrument indicates the extent to which it is exposed to interest rate risk. Interest rate risks are managed by hedging the interest rate profiles of assets and liabilities through the use of exchange-traded and OTC derivatives.
The Bank measures its exposure to market risk and monitors limit compliance daily. The main market risk limits in the Bank are based on eVaR computed at a 95 per cent confidence level over a one-day trading horizon. eVaR is defined as the average potential loss above a certain threshold (for example 95 per cent) that could be incurred due to adverse fluctuations in interest rates and/or foreign exchange rates. The Bank’s overall eVaR limit, laid down in the Board-approved TALP, at a 95 per cent confidence level over a one-day trading horizon is €60.0 million (less than 0.5 per cent of capital).
For enhanced comparability across institutions, numbers disclosed in this financial report show eVaR-based measures scaled up to a 10‑trading-day horizon. The market risk methodology considers the three-month swap curve as the main interest rate risk factor and the other factors as basis spread risk factors.59 The total eVaR (95 per cent confidence level over a 10-day trading horizon) of the Bank’s Treasury portfolio, including basis spread risks, stood at €16.7 million at 31 December 2018 (2017: €11.8 million) with an average eVaR over the year of €13.8 million (2017: €14.8 million). Interest rate option exposure remained modest throughout the year with option eVaR at €1.4 million at year-end (2017: €0.5 million), having peaked at €1.8 million during the year (2017: €2.2 million). The specific contribution from foreign exchange risk to the overall eVaR stood at €0.6 million at year-end (2017: €1.5 million). As in previous years, this contribution was small throughout 2018 and never exceeded €4.8 million (2017: €4.3 million)
Local currency inflation risk
The Treasury portfolio is additionally exposed to local currency market risk in Kazakh Consumer Price Index (CPI) that exposes the Bank to model risk, given that there is no market in Kazakh inflation. Treasury have raised Kazakh tenge through issuances linked to inflation, given that the Kazakh tenge market has no transparent domestic reference rate for borrowing and lending. This risk is mitigated by the fact that the liabilities are largely matched by on-lending linked to Kazakh CPI. At 31 December 2018 surplus Kazakh tenge CPI-linked funding stood at €165 million; these funds were invested predominantly in short-term Kazakhstan Government bonds.
Equity price risk
The Treasury had direct exposure to equity risk of €75 million at 31 December 2018 through three Treasury share investments60 (2017: €76 million). Indirect exposure to equity risk occurs in the form of linked structures that are traded on a back-to-back basis and therefore result in no outright exposure.
C. Liquidity risk
Liquidity risk management process
The Bank’s liquidity policies are reviewed annually and any changes approved by the Board of Directors. The policies are designed to ensure that the Bank maintains a prudent level of liquidity, given the risk environment in which it operates, and to support its AAA credit rating.
The Bank’s medium-term liquidity requirements are based on satisfying each of the following three minimum constraints:
- Net Treasury liquid assets must be at least 75 per cent of the next two years’ projected net cash requirements, without recourse to accessing funding markets.
- The Bank’s liquidity must be considered a strong positive factor when rating agency methodologies are applied. These methodologies include applying haircuts to the Bank’s liquid assets, assessing the level of debt due within one year and considering undrawn commitments. This provides an external view of liquidity coverage under stressed circumstances.
- The Bank must be able to meet its obligations for at least 12 months under an extreme stress scenario. This internally generated scenario considers a combination of events that could detrimentally impact the Bank’s liquidity position.
For the purposes of the net cash requirements coverage ratio above, all assets managed within the Treasury portfolio are considered to be liquid assets while “net” Treasury liquid assets represent gross treasury assets net of short-term debt.61
The Bank holds liquidity above its minimum policy levels to allow flexibility in the execution of its borrowing programme. At 31 December 2018, the Bank’s key medium-term liquidity metrics were as follows:
- Net Treasury liquid assets represented 113 per cent (2017: 148 per cent) of the next two years’ net cash requirements against a minimum 75 per cent coverage. The movement in liquidity coverage relative to the prior year is driven by the planned increase in mandated activities and to a lesser extent scheduled debt redemptions.
- Treasury liquid assets (after the application of haircuts) represented 110 per cent (2017: 106 per cent) of one-year debt service plus
50 per cent of undrawn commitments, against a minimum 100 per cent coverage.
The average weighted maturity of assets managed by Treasury at 31 December 2018 was 1.6 years (2017: 1.4 years).
The Bank’s short-term liquidity policy is based on the principles of the Liquidity Coverage Ratio within the Basel III reform package. The policy requires that the ratio of maturing liquid assets and scheduled cash inflows to cash outflows over both a 30-day and 90-day horizon must be a minimum of 100 per cent. The minimum ratios under the Bank’s policy have been exceeded at 31 December 2018 and consistently throughout the year.
In addition to the above, Treasury actively manages the Bank’s liquidity position on a daily basis.
The Bank has a proven record of access to funding in the capital markets via its global medium-term note programme and commercial paper facilities. In 2018 the Bank raised €8.7 billion of medium to long-term debt with an average tenor of 4.1 years (2017: €8.2 billion and 3.8 years). The Bank’s triple-A credit rating with a stable outlook was affirmed by the three major rating agencies in 2018.
The Bank’s liquidity policies are subject to independent review by Risk Management prior to their submission for Board approval.
The table below is a maturity analysis of the undiscounted cash flows deriving from the Bank’s financial liabilities. Cash flows are presented in the earliest maturity band in which they could potentially fall due. For this purpose, callable debt is profiled in line with options conferring the right to its derivative counterparties to terminate the associated hedging instruments prior to maturity. This reflects how the Bank manages its debt in practice despite the fact that the debt is callable at the option of the Bank and therefore there is no legal obligation to redeem the debt before its legal maturity.
As the figures represent undiscounted cash flows, they do not agree with the balance sheet.
| Financial liabilities at 31 December 2018 | Up to and including 1 month € million | Over 1 month and up to and including 3 months € million | Over 3 months and up to and including 1 year € million | Over 1 year and up to and including 3 years € million | Over 3 years € million | Total € million |
| Non-derivative cash flows | ||||||
| Amounts owed to credit institutions | (1,581) | (362) | (145) | – | (50) | (2,138) |
| Debts evidenced by certificates | (1,013) | (3,922) | (10,802) | (15,493) | (12,320) | (43,550) |
| Other financial liabilities | (6) | (16) | (74) | (67) | (174) | (337) |
| At 31 December 2018 | (2,600) | (4,300) | (11,021) | (15,560) | (12,544) | (46,025) |
| Trading derivative cash flows | ||||||
| Net settling interest rate derivatives | (4) | (6) | (39) | (67) | (59) | (175) |
| Gross settling interest rate | (36) | (116) | (1,208) | (565) | (1,382) | (3,307) |
| derivatives – outflow | ||||||
| Gross settling interest rate | 31 | 98 | 1,169 | 554 | 1,047 | 2,899 |
| derivatives – inflow | ||||||
| Foreign exchange derivatives – outflow | (5,077) | (2,483) | (700) | -16 | – | (8,276) |
| Foreign exchange derivatives – inflow | 5,045 | 2,467 | 675 | 15 | – | 8,202 |
| At 31 December 2018 | (41) | (40) | (103) | (79) | (394) | (657) |
| Hedging derivative cash flows | ||||||
| Net settling interest rate derivatives | (2) | (35) | (97) | (92) | (11) | (237) |
| Gross settling interest rate | (153) | (268) | (1,793) | (2,592) | (3,908) | (8,714) |
| derivatives – outflow | ||||||
| Gross settling interest rate | 130 | 231 | 1,696 | 2,463 | 3,289 | 7,809 |
| derivatives – inflow | ||||||
| At 31 December 2018 | (25) | (72) | (194) | (221) | (630) | (1,142) |
| Total financial liabilities at 31 December 2018 | (2,666) | (4,412) | (11,318) | (15,860) | (13,568) | (47,824) |
| Other financial instruments | ||||||
| Undrawn commitments | ||||||
| Financial institutions | (2,481) | – | – | – | – | (2,481) |
| Non-financial institutions | (10,587) | – | – | – | – | (10,587) |
| At 31 December 2018 | (13,068) | – | – | – | – | (13,068) |
| Financial liabilities at 31 December 2017 | Up to and including 1 month € million | Over 1 month and up to and including 3 months € million | Over 3 months and up to and including 1 year € million | Over 1 year and up to and including 3 years € million | Over 3 years € million | Total € million |
| Non-derivative cash flows | ||||||
| Amounts owed to credit institutions | (2,226) | (367) | (91) | – | – | (2,684) |
| Debts evidenced by certificates | (961) | (1,609) | (10,412) | (15,128) | (13,591) | (41,701) |
| Other financial liabilities | (2) | (13) | (113) | (77) | (45) | (250) |
| At 31 December 2017 | (3,189) | (1,989) | (10,616) | (15,205) | (13,636) | (44,635) |
| Trading derivative cash flows | ||||||
| Net settling interest rate derivatives | (3) | (6) | (24) | (48) | (87) | (168) |
| Gross settling interest rate | (349) | (371) | (1,124) | (894) | (873) | (3,611) |
| derivatives – outflow | ||||||
| Gross settling interest rate | 322 | 327 | 1,105 | 843 | 913 | 3,510 |
| derivatives – inflow | ||||||
| Foreign exchange derivatives – outflow | (5,579) | (3,479) | (1,145) | – | – | (10,203) |
| Foreign exchange derivatives – inflow | 5,448 | 3,428 | 1,125 | – | – | 10,001 |
| Credit derivatives | – | – | – | (1) | (1) | (2) |
| At 31 December 2017 | (161) | (101) | (63) | (100) | (48) | (473) |
| Hedging derivative cash flows | ||||||
| Net settling interest rate derivatives | (2) | (7) | (32) | (104) | (38) | (183) |
| Gross settling interest rate derivatives – outflow | (142) | (123) | (334) | (619) | (1,426) | (2,644) |
| Gross settling interest rate derivatives – inflow | 145 | 132 | 297 | 642 | 1,405 | 2,621 |
| At 31 December 2017 | 1 | 2 | (69) | (81) | (59) | (206) |
| Total financial liabilities at 31 December 2017 | (3,349) | (2,088) | (10,748) | (15,386) | (13,743) | (45,314) |
| Other financial instruments | ||||||
| Undrawn commitments | ||||||
| Financial institutions | (2,621) | – | – | – | – | (2,621) |
| Non-financial institutions | (10,149) | – | – | – | – | (10,149) |
| At 31 December 2017 | (12,770) | – | – | – | – | (12,770) |
D. Operational risk
The Bank defines operational risk as all aspects of risk-related exposure other than those falling within the scope of credit, market and liquidity risk. This includes the risk of loss (financially and/or to our reputation) resulting from inadequate or failed internal processes, people and systems or from external events.
Sources of operational risk
Operational risk can manifest itself in various ways, including business interruptions, inappropriate behaviour of employees (including fraud), failure to comply with applicable laws and regulations or failure of vendors to perform in accordance with their contractual arrangements. These events could result in financial losses, as well as reputational damages to the Bank.
Operational Risk Framework
The Bank’s Operational Risk Framework (ORF) is a network of processes, procedures, reports and responsibilities that are used
to identify, manage and monitor the operational risks of the Bank. These include governance committees, day-to-day management practices such as the collection and analysis of key risks, risk of loss incidents and both strategic and cultural practices.
The ORF provides a structured approach to managing operational risk. It seeks to apply consistent standards and techniques for evaluating risks across the Bank within which individual businesses have sufficient flexibility to tailor specific components to their own needs.
The main components of the Operational Risk Framework are described below:
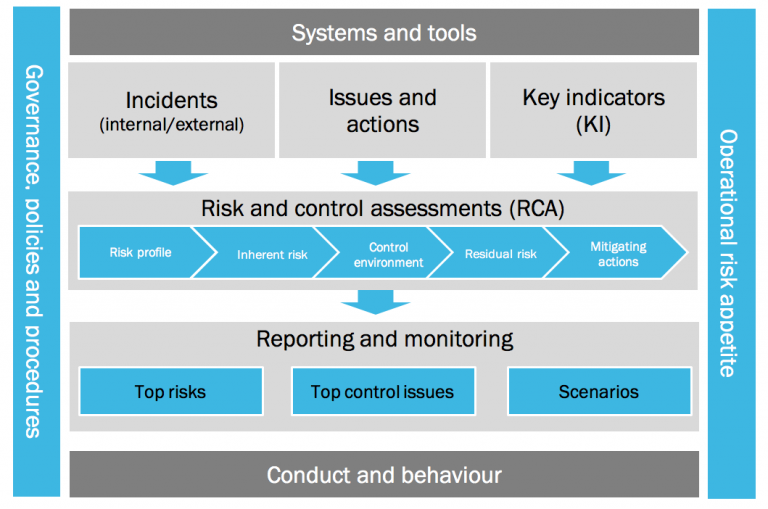
Governance, policies and procedures
The Bank utilises a comprehensive set of policies and procedures that set out how operational risks should be managed throughout the Bank.
Operational risk appetite
This determines the Bank’s approach to risk taking and articulates the motivations for taking, accepting or avoiding certain types of risks or exposures.
Incidents
The Bank systematically collects, analyses and reports data on operational risk incidents to ensure it understands the reasons they occurred and how controls can be improved to reduce the risk of future incidents. It also collects and utilises available data on incidents at relevant peer firms through the Global Operational Risk Loss Database to identify potential risks that may be relevant in the future, even if they have not currently impacted the Bank.
Issues and actions
Issues comprise a catalogue of problems the business faces with potential operational risks arising as a consequence of business activities. Actions address these issues and are steps taken to ensure these issues do not present operational risks.
Key indicators
These are metrics that are used to monitor particular operational risks and controls over time.
Risk and control assessments
Risk and control assessments are comprehensive, bottom-up assessments of the key operational risks in each business. They comprise a self-assessment that defines a risk profile based on Bank-wide operational risk taxonomy, classifies risks under a standardised approach, covers the inherent risks of each business and control function, provides an evaluation of the effectiveness of the controls in place to mitigate these risks, determines the residual risk ratings and requires a decision to either accept or remediate any residual risks.
Reporting and monitoring
The Bank produces a wide range of regular management information reports covering the key inputs and outputs of the ORF. These reports are used by senior management to monitor outcomes against agreed targets and tolerance levels.
Systems and tools
The Bank utilises system and tools to ensure operational risks are identified and managed properly.
Conduct and behaviour
Several ORF components include assessments of behaviour as effective operational risk management relies on employees conducting themselves appropriately. For example, investigations of incidents typically consider whether employees escalated issues at an appropriately early stage. Risks that have implications for conduct risk can be identified and assessed via the operational risk register and the risk and control assessment process.
Key risks and mitigations
The Bank continually assesses and strengthens its risk and control processes and technological support tools to increase their effectiveness.
The following table summarises key operational risks currently considered most relevant to its business.
| Key risk | Description | How is the risk managed |
| Reputational risk | Reputational risk can arise from any of the key risks outlined below. Reputational risk relates to the Bank’s brand, as well as ethics, trust, relationships with clients and stakeholders, conduct and the overall culture and values of our organisation. Reputational risk may also arise from taking on inappropriate client relationships which may have adverse implications for the Bank. | Consider key reputational risks when initiating changes in strategy or operating model. Engage in proactive communications with all stakeholders and monitor media coverage to understand how our reputation is perceived. In addition, a number of controls and frameworks are in place to address other risks that could affect our reputation including: conduct risk, financial crime, investment risk and client take-on and product development. |
| Conduct risk | The potential detriment to the EBRD, its stakeholders and clients with respect to investment management, lending fraud, market integrity, money laundering, bribery and corruption. | Managed through a framework focusing on enhancements to risk identification, mitigation, management information, reporting in conjunction with line management, OCCO and Human Resources. |
| People risk | The risk that losing one important employee or team would cause a significant negative impact to the Bank or that failing to attract talent leads to sub-optimal performance. This relates to investment staff or teams associated with key products or other individuals with significant experience or specialist knowledge (for example, key operator or IT system specialists). | Key mitigations include identifying and developing resources to support front to back processes, talent management programme and succession planning. Develop comprehensive procedure documentation of all key processes and where possible include as part of disaster recovery tests. |
| Process risk | Risk arising from the failure of significant business processes undertaken by the EBRD, including for example critical transaction and payments processing, client suitability checks and asset pricing. | Risk and control assessments are used to identify and assess key operational risks. Associated controls are assessed with regard to their design and performance. Where required, processes and controls are enhanced to improve the control environment with the aim of preventing risk events from recurring. |
| Change management risk/project risk | Risk of negative impact from change/projects/initiatives. Project risk is the risk that ineffective project implementation could lead to sub-optimal solutions being delivered on our key projects. | Dedicated change management team overseeing all major projects, ensuring that consistent, Bank-wide rigour is brought to the initiation, approval and monitoring of projects. The Bank does not implement new processes and systems before they have been fully tested. |
| Cyber crime | Risk of loss or detriment to the Bank’s business and customers as a result of actions committed or facilitated through the use of networked information systems. | The Bank’s IT and information security procedures and processes ensure that all servers and computers have up to date antivirus software. Backups are made regularly and regular access control checks, system penetration and vulnerability tests along with disaster recovery tests are performed. The Bank’s anti-cyber attack controls are checked and aligned with external best practice. |
| Business resilience risk | Business resilience risk is the risk that, for a number of reasons, the Bank is unable to continue to operate. | Resilience planning is in place across the business with clear identification of key staff and their involvement in business resumption plans. This includes annual disaster recovery testing at the Bank’s back-up site. Bank-wide insurance held against a loss resulting from interruption to the business as a consequence of loss of or damage to our property. The Bank works closely with its third-party suppliers to maintain the quality and continuity of service. |
| Technology risk | The risks that the Bank’s technology systems and support are inadequate or fail to adapt to changing requirements. | Build a technology risk management operating model that enables the organisation to identify, measure, and manage technology risks against its business objectives, critical processes, and information risks. Ensure consideration for key areas such as incident, change, and capacity management. Regularly review the progress of major information technology projects and new systems are subject to rigorous testing before approval. |
| Third-party service provider risk | Inadequate selection and ongoing management of external suppliers. Third-party service provider risk relates to the risk that suppliers may not be able to meet their agreed service level terms. | Before entering into third-party arrangements, the Bank undertakes due diligence on third-party suppliers and maintain a programme of regular assessment against agreed service levels. Exit plans are considered prior to appointment and provide a framework for transitioning business from one service provider to another should the quality fall below the agreed service level. |
Outlook
The overall operational risk outlook remains materially unchanged from previous year. The Bank continues to focus on strengthening its information, cyber security and business resilience capabilities and practices.
To reduce the expected technology risk that naturally arises from the life expectancy of our IT estate and to address the growing market experience of sophisticated challenges to IT security, the Bank is taking steps to modernise IT delivery and service. This programme will commence in 2019 and is expected to be substantially implemented by the end of 2020. As with all material IT change projects, and despite appropriate mitigation and monitoring, this will lead to an increase in the residual operational risk exposure during the transition.
The Bank also remains vigilant on the potential impact of Brexit on our staff and business. A Brexit working group has been established and is liaising closely with all staff and a number of external organisations; however, it is confident that the Bank will be able to address any challenges this may present.
E. Capital management
The Bank’s original authorised share capital was €10.0 billion. Under Resolution No. 59, adopted on 15 April 1996, the Board of Governors approved a doubling of the Bank’s authorised capital stock to €20.0 billion.
In accordance with the requirements of Article 5.3 of the Agreement, the Board of Governors reviews the capital stock of the Bank at intervals of not more than five years. At the Annual Meeting in May 2010 the Bank’s Board of Governors approved the Fourth Capital Resources Review (CRR4) which established the Bank’s strategy for the period 2011-15. This included an analysis of the transition impact and operational activity of the Bank; an assessment of the economic outlook and transition challenges in the region; the formulation of medium-term portfolio development strategy and objectives; and a detailed analysis of the Bank’s projected future financial performance and capital adequacy. The review underlined the fact that the Bank relies on a strong capital base and stressed the need for prudent financial policies supporting conservative provisioning, strong liquidity and long-term profitability.
As a result of the assessment of capital requirements in CRR4, in May 2010 the Board of Governors approved a two-step increase in the authorised capital stock of the Bank: an immediate €1.0 billion increase in authorised paid-in shares (Resolution No. 126), and a €9.0 billion increase in authorised callable capital shares (Resolution No. 128). This amounts to an aggregate increase in the authorised capital stock of the Bank of €10.0 billion (collectively referred to as the second capital increase). The increase in callable capital became effective on 20 April 2011 when subscriptions were received for at least 50 per cent of the newly authorised callable capital. The callable shares were issued subject to redemption in accordance with the terms of Resolution No. 128. At 31 December 2018, €8.9 billion of the callable capital increase had been subscribed (2017: €8.9 billion).
At the May 2015 Annual Meeting the Board of Governors reviewed the capital stock of the Bank pursuant to Article 5.3 of the Agreement and resolved that the projected capital stock is appropriate for the 2016-20 period, in the context of the approval of the Bank’s Strategic and Capital Framework 2016-20. The Board of Governors further resolved that no callable capital shares would be redeemed and that the redemption and cancellation provisions in Resolution No. 128 be removed. Finally, the Board of Governors resolved that the adequacy of the Bank’s capital would next be reviewed at the 2020 Annual Meeting (Resolutions No. 181, 182 and 183).
The Bank does not have any other classes of capital.
The Bank’s capital usage is guided by statutory and financial policy parameters. Article 12 of the Agreement establishes a 1:1 gearing ratio which limits the total amount of outstanding loans, share investments and guarantees made by the Bank in the economies in which it invests to the total amount of the Bank’s unimpaired subscribed capital, reserves and surpluses. This capital base incorporates unimpaired subscribed capital (including callable capital), the unrestricted general reserves, loan loss reserve, special reserve and adjustments for general loan impairment provisions on Banking exposures and unrealised equity losses. Reflecting a change in interpretation in 2015, specific provisions are not included in the statutory capital base. The capital base for these purposes amounted to €40.5 billion62 at 31 December 2018 after 2018 net income allocation decisions (2017: €40.3 billion).
The Bank interprets the gearing ratio on a “disbursed Banking assets” or “operating assets” basis. To ensure consistency with the statutory capital base, specific provisions are deducted from total operating assets for the purposes of the ratio. At 31 December 2018, the Bank’s gearing ratio on an aggregated basis was 73 per cent (2017: 70 per cent). Article 12 also limits the total amount of disbursed share investments to the total amount of the Bank’s unimpaired paid-in subscribed capital, surpluses and general reserve. No capital utilisation limits were breached during the year (2017: none).
The Bank’s statutory measure of capital adequacy under the gearing ratio is supplemented by a risk-based prudential capital adequacy limit under its Capital Adequacy Policy.
The Bank defines required capital as the potential capital losses it may incur based on probabilities consistent with the Bank’s AAA credit rating. The main risk categories assessed under the capital adequacy framework are credit risk, market risk and operational risk, and the total risk is managed within an available capital base that excludes callable capital, while maintaining a prudent capital buffer.
One of the main objectives of the Capital Adequacy Policy is to manage the Bank’s capital within a medium-term planning framework, providing a consistent measurement of capital headroom over time. The Bank’s objective is to prevent the need to call on subscribed callable capital and to use only available risk capital including paid-in capital and reserves.
At 31 December 2018 the ratio of required capital to available capital was 73 per cent (2017: 70 per cent) compared with a policy threshold for this ratio of 90 per cent. The Bank’s risk-based capital requirement under this policy is managed alongside the Bank’s statutory capital constraint.
The Bank’s prudent approach to capital management is reflected in the key financial ratios section. At 31 December 2018, the ratio of members’ equity to total assets was 26 per cent (2017: 29 per cent) and the ratio of members’ equity to Banking assets was 58 per cent (2017: 60 per cent).
F. Fair value of financial assets and liabilities
Classification and fair value of financial assets and liabilities
| Financial assets at 31 December 2018 | Carrying amount € million | Fair value € million |
| Financial assets measured at fair value through profit or loss or fair value through other comprehensive income: | ||
| Debt securities | 1,604 | 1,604 |
| Derivative financial instruments | 3,948 | 3,948 |
| Banking loans at fair value through profit or loss | 460 | 460 |
| Banking loans at fair value through other comprehensive income | 1,737 | 1,737 |
| Banking portfolio: Share investments at fair value through profit or loss | 4,745 | 4,745 |
| Treasury portfolio: Share investments at fair value through other comprehensive income | 75 | 75 |
| 12,569 | 12,569 | |
| Financial assets measured at amortised cost:63 | ||
| Placements with and advances to credit institutions | 16,014 | 16,014 |
| Debt securities | 11,343 | 11,312 |
| Other financial assets | 381 | 381 |
| Banking loan investments at amortised cost | 21,432 | 21,957 |
| 49,170 | 49,664 | |
| Total | 61,739 | 62,233 |
| Financial assets at 31 December 2017 | Carrying amount € million | Fair value € million |
| Financial assets measured at fair value through profit or loss or fair value through other comprehensive income: | ||
| Debt securities | 916 | 916 |
| Derivative financial instruments | 3,677 | 3,677 |
| Banking loans at fair value through profit or loss | 372 | 372 |
| Banking portfolio: Share investments at fair value through profit or loss | 4,834 | 4,834 |
| Treasury portfolio: Share investments at fair value through other comprehensive income | 76 | 76 |
| 9,875 | 9,875 | |
| Financial assets measured at amortised cost: | ||
| Placements with and advances to credit institutions | 14,605 | 14,605 |
| Debt securities | 9,465 | 9,512 |
| Other financial assets | 352 | 352 |
| Banking loan investments at amortised cost | 21,780 | 22,314 |
| 46,202 | 46,783 | |
| Total | 56,077 | 56,658 |
| Financial liabilities at 31 December 2018 | Held for trading € million | At fair value through profit or loss € million | Derivatives held for hedging purposes € million | Financial liabilities at amortised cost € million | Carrying amount € million | Fair value € million |
| Amounts owed to credit institutions | – | – | – | (2,107) | (2,107) | (2,107) |
| Debts evidenced by certificates | – | – | – | (40,729) | (40,729) | (40,642) |
| Derivative financial instruments | (300) | (99) | (1,680) | – | (2,079) | (2,079) |
| Other financial liabilities | – | (111) | – | (542) | (653) | (653) |
| Total financial liabilities | (300) | (210) | (1,680) | (43,378) | (45,568) | (45,481) |
| Financial liabilities at 31 December 2017 | Held for trading € million | At fair value through profit or loss € million | Derivatives held for hedging purposes € million | Financial liabilities at amortised cost € million | Carrying amount € million | Fair value € million |
| Amounts owed to credit institutions | – | – | – | (2,650) | (2,650) | (2,650) |
| Debts evidenced by certificates | – | – | – | (35,116) | (35,116) | (34,964) |
| Derivative financial instruments | (392) | (77) | (1,355) | – | (1,824) | (1,824) |
| Other financial liabilities | – | – | – | (431) | (431) | (431) |
| Total financial liabilities | (392) | (77) | (1,355) | (38,197) | (40,021) | (39,869) |
At 31 December 2018, the Bank’s balance sheet approximates to fair value in all financial asset and liability categories, with the exception of loan investments at amortised cost.
The amortised cost instruments held within placements with and advances to credit institutions, other financial assets, amounts owed to credit institutions, and other financial liabilities are all deemed to have amortised cost values approximating their fair value, being primarily simple, short-term instruments. They are classified as having Level 2 inputs (see fair value hierarchy, below) as the Bank’s assessment of their fair value is based on the observable market valuation of similar assets and liabilities.
Amortised cost debt securities are valued using Level 2 inputs. The basis of their fair value is determined using valuation techniques appropriate to the market and industry of each investment. The primary valuation techniques used are quotes from brokerage services and discounted cash flows. Techniques used to support these valuations include industry valuation benchmarks and recent transaction prices.
Banking loan investments whereby the objective of the Bank’s business model is to hold these investments to collect the contractual cash flow, and the contractual terms give rise on specified dates to cash flows that are solely payments of principal and interest, are recognised at amortised cost. The fair value of these loans was calculated using Level 3 inputs by discounting the cash flows at a year‑end interest rate applicable to each loan and further discounting the value by an internal measure of credit risk.
Debts evidenced by certificates represents the Bank’s borrowings raised through the issuance of commercial paper and bonds.64 The fair value of the Bank’s issued bonds is determined using discounted cash flow models and therefore relies on Level 3 inputs. Due to the short‑tenor nature of commercial paper, amortised cost approximates fair value. The fair value of the Bank’s issued commercial paper is determined based on the observable market valuation of similar assets and liabilities and therefore relies on Level 2 inputs.
Fair value hierarchy
IFRS 13 specifies classification of fair values on the basis of a three-level hierarchy of valuation methodologies. The classifications are determined based on whether the inputs used in the measurement of fair values are observable or unobservable. These inputs have created the following fair value hierarchy:
- Level 1 – Quoted prices in active markets for identical assets or liabilities. This level includes listed share investments on
stock exchanges and listed bonds classified as loans held at fair value through other comprehensive income. - Level 2 – Inputs other than quoted prices included within Level 1 that are observable for the asset or liability, either directly (that is, as prices) or indirectly (that is, derived from prices). This level includes debt securities, most derivative products and listed share and bond investments valued using a quoted price but where there is no market sufficiently active to be included in Level 1. The sources of inputs include prices available from screen-based services such as SuperDerivatives and Bloomberg, broker quotes and observable market data such as interest rates and foreign exchange rates which are used in deriving the valuations of derivative products.
- Level 3 – Inputs for the asset or liability that are not based on observable market data (unobservable inputs). This level includes share investments and debt securities or derivative products for which not all valuation inputs are observable.
The table below provides information at 31 December 2018 about the Bank’s financial assets and financial liabilities measured at fair value. Financial assets and financial liabilities are classified in their entirety based on the lowest level input that is significant to the fair value measurement.
| At 31 December 2018 | ||||
| Level 1 € million | Level 2 € million | Level 3 € million | Total € million |
|
| Debt securities | – | 1,604 | – | 1,604 |
| Derivative financial instruments | – | 3,449 | 499 | 3,948 |
| Banking loans | 1,737 | – | 460 | 2,197 |
| Share investments (Banking portfolio) | 1,520 | 51 | 3,174 | 4,745 |
| Share investments (Treasury portfolio) | – | 75 | – | 75 |
| Total financial assets at fair value | 3,257 | 5,179 | 4,133 | 12,569 |
| Derivative financial instruments | – | (1,980) | (99) | (2,079) |
| Other liabilities | – | – | (111) | (111) |
| Total financial liabilities at fair value | – | (1,980) | (210) | (2,190) |
| At 31 December 2017 | ||||
| Level 1 € million | Level 2 € million | Level 3 € million | Total € million |
|
| Debt securities | – | 916 | – | 916 |
| Derivative financial instruments | – | 3,215 | 462 | 3,677 |
| Banking loans | – | – | 372 | 372 |
| Share investments (Banking portfolio) | 1,548 | – | 3,286 | 4,834 |
| Share investments (Treasury portfolio) | – | 76 | – | 76 |
| Total financial assets at fair value | 1,548 | 4,207 | 4,120 | 9,875 |
| Derivative financial instruments | – | (1,747) | (77) | (1,824) |
| Total financial liabilities at fair value | – | (1,747) | (77) | (1,824) |
During 2018 €51 million worth of Banking share investments were transferred from Level 1 to Level 2. These transfers have occurred when the volume of trading of these investments has fallen to a level that is insufficient for their market to be deemed active.
The table below provides a reconciliation of the fair values of the Bank’s Level 3 financial assets and financial liabilities for the year ended 31 December 2018.
| Derivative financial instruments € million | Banking loans € million | Banking share investments € million | Total assets € million | Other liabilities € million | Derivative financial instruments € million | Total liabilities € million |
|
| Balance at 31 December 2017 | 462 | 372 | 3,286 | 4,120 | – | (77) | (77) |
| Total (losses)/gains for the year ended 31 December 2018 in: | |||||||
| Net (loss)/gains | 99 | 34 | 94 | 227 | – | (22) | (22) |
| Deferred loss | (8) | – | – | (8) | – | – | – |
| Purchases/issues | – | 132 | 362 | 494 | -70 | – | (70) |
| Sales/settlements | (47) | (62) | (559) | (668) | – | – | – |
| Write offs | – | (16) | (9) | (25) | – | – | – |
| Transfers (out of)/into) Level 3 | (7) | – | – | (7) | (41) | – | (41) |
| Balance at 31 December 2018 | 499 | 460 | 3,174 | 4,133 | (111) | (99) | (210) |
| Total gains/(losses) for the period included in net profit from assets and liabilities held at 31 December 2018 | 110 | 25 | 36 | 171 | – | (9) | (9) |
| Derivative financial instruments € million | Banking loans € million | Banking share investments € million | Total assets € million | Derivative financial instruments € million | Total liabilities € million |
|
| Balance at 31 December 2016 | 577 | 313 | 3,455 | 4,345 | (51) | (51) |
| Total gains/(losses) for the year ended 31 December 2017 in: | ||||||
| Net profit/(loss) | (82) | (2) | 157 | 73 | (26) | (26) |
| Deferred profit | 56 | – | – | 56 | – | – |
| Purchases/issues | – | 106 | 389 | 495 | – | – |
| Sales/settlements | (89) | (56) | (667) | (812) | – | – |
| Write offs | – | (21) | – | (21) | – | – |
| Reclassification | – | 32 | – | 32 | – | – |
| Transfers out of Level 3 | – | – | (48) | (48) | – | – |
| Balance at 31 December 2017 | 462 | 372 | 3,286 | 4,120 | (77) | (77) |
| Total gains/(losses) for the period included in net profit for assets and liabilities held at 31 December 2017 | 34 | (14) | 100 | 120 | (39) | (39) |
Transfers into and out of Level 3 for Banking share investments relate to listed investments that switch from/(to) an actively traded market.
Level 3 – sensitivity analysis
The table below presents the Level 3 financial instruments carried at fair value at 31 December 2018, the main valuation models/techniques65 used in the valuation of these financial instruments and the estimated increases or decreases in fair value based on reasonably possible alternative assumptions:
| Impact on net profit in 2018 | ||||
| Main valuation models/techniques | Carrying amount € million | Favourable change € million | Unfavourable change € million |
|
| Banking loans | DCF and option pricing models | 460 | 44 | (31) |
| Banking share investments, EPF and associated derivatives66 | NAV and EBITDA multiples, DCF models, compounded interest and option pricing models | 3,463 | 407 | (343) |
| At 31 December | 3,923 | 451 | (374) | |
| Impact on net profit in 2017 | ||||
| Main valuation models/techniques | Carrying amount € million | Favourable change € million | Unfavourable change € million |
|
| Treasury derivative financial instruments | DCF models | 7 | – | (1) |
| Banking loans | DCF and option pricing models | 372 | 12 | (17) |
| Banking share investments and associated derivatives | NAV and EBITDA multiples, DCF models, compounded interest and option pricing models | 3,664 | 760 | (732) |
| At 31 December | 4,043 | 772 | (750) | |
Treasury debt securities and derivative financial instruments
The Bank’s derivative instruments held within the Treasury portfolio are valued through DCF models. Valuations are reconciled to counterparty statements on a daily basis. Therefore, the reasonable possible alternative valuations have been determined based on the range of discrepancies between the Bank’s valuations and those of our counterparties.
The Bank’s debt securities are priced via a third-party market data service, screen-based services such as Bloomberg or using broker quotes.
Banking loans
Banking loans at fair value through profit or loss mainly comprise convertible loans or loans with an element of performance-based return. The valuation models/techniques used to derive the fair value of these instruments are DCF models and option pricing models. The inputs into the models include interest rates, the borrower’s credit spreads and underlying equity prices. Reasonable possible alternative valuations have been determined based on the borrower’s probability of default, alternative EBITDA multiples and changes to assumptions in underlying DCF models, for example, amending the discount rate.
Banking loans at fair value through other comprehensive income comprise listed bonds for which there is an active market. They are valued based on the traded price observable in the market.
Banking share investments and derivatives
The Bank’s unlisted equity portfolio comprises direct share investments, equity derivatives and equity funds. The main valuation models/techniques used to determine the fair value of these financial instruments are NAV multiples, EBITDA multiples and DCF models.
NAV multiples are most commonly applied to bank investments and equity funds. Recent transactions within sectors are also considered where available. Reasonable possible alternative valuations have been determined based on the NAV multiple ranges in the valuations received for bank investments, and by considering the impact of adjusting the portfolio discount applied to equity funds. For investments valued using EBITDA multiples and DCF models, sensitivity analysis was performed by determining reasonable alternative valuations using sales, EBITDA, price-to-earnings multiples methods, as well as industry specific methods like multiples based on production capacities. Further, within a given method valuation ranges were determined by using bottom and top quartile multiples. For DCF models, sensitivity analysis was performed by changing certain underlying assumptions (for example, an increase or decrease in the discount rate).5
Notes to the financial statements
1. Establishment of the Bank
I. Agreement Establishing the Bank
The European Bank for Reconstruction and Development (the Bank), whose principal office is located in London, is an international organisation formed under the Agreement Establishing the Bank dated 29 May 1990 (the Agreement). At 31 December 2018, the Bank’s members comprised 67 countries, together with the European Union and the European Investment Bank.
II. Headquarters Agreement
The status, privileges and immunities of the Bank and persons connected with the Bank in the United Kingdom are confirmed and supplemented in the Headquarters Agreement between the Government of the United Kingdom of Great Britain and Northern Ireland and the Bank (Headquarters Agreement). The Headquarters Agreement was signed in London at the start of the Bank’s operations on 15 April 1991.
2. Segment information
The Bank’s activities are primarily Banking and Treasury. Banking activities represent investments in projects that, in accordance with the Agreement, are made for the purpose of assisting the economies in which the Bank invests in their transition to open, market economies whilst fostering sustainable and inclusive growth and applying sound banking principles. The main investment products are loans, share investments and guarantees. Treasury activities include raising debt finance, investing surplus liquidity, managing the Bank’s foreign exchange and interest rate risks and assisting clients in asset and liability management matters.
Information on the financial performance of Banking and Treasury operations is prepared regularly and provided to the President,
the Bank’s chief operating decision-maker. On this basis, Banking and Treasury operations have been identified as the operating segments.
Segment performance
The President assesses the performance of the operating segments based on the net profit for the year, which is measured in a manner consistent with the financial statements. The segment information provided to the President for the operating segments for the years ended 31 December 2018 and 31 December 2017 is as follows:
| Banking 2018 € million | Treasury 2018 € million | Aggregated 2018 € million | Banking 2017 € million | Treasury 2017 € million | Aggregated 2017 € million |
|
| Interest income | 1,064 | 348 | 1,412 | 974 | 173 | 1,147 |
| Other income | 146 | 34 | 180 | 411 | 49 | 460 |
| Total segment revenue | 1,210 | 382 | 1,592 | 1,385 | 222 | 1,607 |
| Interest expense and similar charges | (396) | (435) | (831) | (286) | (143) | (429) |
| Net interest income on derivatives | – | 170 | 170 | – | 36 | 36 |
| General administrative expenses | (371) | (20) | (391) | (371) | (24) | (395) |
| Depreciation and amortisation | (28) | (1) | (29) | (24) | (2) | (26) |
| Segment result before provisions and hedges | 415 | 96 | 511 | 704 | 89 | 793 |
| Fair value movement on non-qualifying and ineffective hedges | – | 21 | 21 | – | (20) | (20) |
| Provisions for impairment of loan investments and guarantees | (192) | – | (192) | (1) | – | (1) |
| Net profit for the year | 223 | 117 | 340 | 703 | 69 | 772 |
| Transfers of net income approved by the Board of Governors | (130) | (180) | ||||
| Net profit after transfers approved by the Board of Governors | 210 | 592 | ||||
| Segment assets | ||||||
| Total assets | 29,266 | 32,585 | 61,851 | 27,819 | 28,374 | 56,193 |
| Segment liabilities | ||||||
| Total liabilities | 436 | 45,132 | 45,568 | 328 | 39,694 | 40,022 |
Segment revenues – geographic
The Bank’s activities are divided into six regions for internal management purposes.
| Segment revenue 2018 € million | Segment revenue 2017 € million |
|
| Advanced countries67 | 129 | 270 |
| Early/intermediate countries68 | 711 | 761 |
| Russian Federation | (78) | (38) |
| SEMED | 165 | 107 |
| Turkey | 283 | 285 |
| OECD69 | 382 | 222 |
| Total | 1,592 | 1,607 |
Revenues are attributed to regions on the basis of the location in which a project operates.
3. Net interest income
| 2018 € million | 2017 € million |
|
| Banking loans | 1,064 | 974 |
| Debt securities | 196 | 101 |
| Reverse repurchase agreements | 28 | 17 |
| Cash and short-term funds | 99 | 55 |
| Other | 25 | – |
| Interest and similar income | 1,412 | 1,147 |
| Debts evidenced by certificates | (747) | (360) |
| Amounts owed to credit institutions | (83) | (69) |
| Other | (1) | – |
| Interest expense and similar charges | (831) | (429) |
| Net interest income on derivatives | 170 | 36 |
| Net interest income | 751 | 754 |
Interest income accrued on impaired financial assets during 2018 was €21 million (2017: €16 million).70
4. Net fee and commission income
The main components of net fee and commission income are as follows:
| 2018 € million | 2017 € million |
|
| Commitment fees | 53 | 48 |
| Syndication and agency fees | 4 | 3 |
| Administration fees | 7 | 4 |
| Prepayment fees | 4 | 3 |
| Trade finance fees | 9 | 8 |
| Equity fees | 6 | 6 |
| Railcar income71 | 9 | 5 |
| Other | 9 | 3 |
| Fee and commission income | 101 | 80 |
| Equity fees | (4) | (2) |
| Other | (4) | (4) |
| Fee and commission expense | (8) | (6) |
| Net fee and commission income | 93 | 74 |
Front-end and appraisal fees of €69 million (2017: €62 million) received in 2018, together with related direct costs of €4 million (2017: €4 million), have been deferred on the balance sheet. They will be recognised in interest income over the period from disbursement to repayment of the related loan as part of the loan’s effective interest, in accordance with IFRS 9.
5. Net (losses)/gains from share investments at fair value through profit or loss
On exit of an equity investment, the cumulative gain/loss is realised with a corresponding reversal of the cumulative unrealised gain/loss recorded prior to the exit.
| 2018 € million | 2017 € million |
|
| Net realised (losses)/gains from share investments and equity-related derivatives | (105) | 40 |
| Net unrealised (losses)/gains from share investments and equity-related derivatives | (71) | 107 |
| Net (losses)/gains from share investments at fair value through profit or loss | (176) | 147 |
6. Net gains from loans
| 2018 € million | 2017 € million |
|
| Realised gains from loans at fair value through profit or loss | 6 | – |
| Loans at fair value through profit or loss written off | (16) | (21) |
| Unrealised fair value gains on loans at fair value through profit or loss | 19 | 25 |
| Unrealised foreign exchange gains/(losses) on loans at fair value through profit or loss | 6 | (6) |
| Net gains/(losses) from loans at fair value through profit or loss | 15 | (2) |
| Realised gains from loans at amortised cost | 7 | 7 |
| Realised gains from loans at fair value through other comprehensive income | 3 | – |
| Net gains from loans | 25 | 5 |
7. Net gains from Treasury assets held at amortised cost
| 2018 € million | 2017 € million |
|
| Net realised gains from debt securities at amortised cost | – | 2 |
| Net gains from Treasury assets held at amortised cost | – | 2 |
During the year the Bank sold €195 million of debt securities held at amortised cost (2017: €556 million).
8. Net gains from Treasury activities at fair value through profit or loss
| 2018 € million | 2017 € million |
|
|---|---|---|
| Debt buy-backs and termination of related derivatives | 1 | – |
| Balance sheet management | 33 | 42 |
| Internally managed dealing portfolio designated at fair value | – | 5 |
| Net gains from Treasury activities at fair value through profit or loss | 34 | 47 |
Treasury balance sheet management activities are primarily concerned with the management of market risks across the Bank’s balance sheet together with short-term liquidity management. The financial performance of these activities is affected by the currency basis spreads used in the valuation of swaps through which Treasury funds the Bank’s local currency denominated loan portfolio.72 These swaps are used for funding purposes and so will be held to maturity; any unrealised valuation losses or gains caused by the volatility in currency basis spreads will reverse over time.73 A €4 million gain was recognised in 2018 relating to these spreads (2017: €13 million gain).
The profit deriving from the Bank’s debt buyback activities is unpredictable as it typically occurs through the Bank responding to investors looking to exit holdings of the Bank’s debt.
9. Fair value movement on non-qualifying and ineffective hedges
The hedging practices and accounting treatment are disclosed under “Derivative financial instruments and hedge accounting” in the Accounting Policies section of this report.
The fair value movement on non-qualifying and ineffective hedges represents an accounting adjustment in respect of hedging relationships undertaken by the Bank that either do not qualify for hedge accounting or do not fully offset when measured in accordance with IFRS. This unrealised adjustment does not reflect economic substance, inasmuch as the reported losses would not be realised in cash if the hedging relationships were terminated. The adjustment will reverse over time as the underlying deals approach their maturities.
The Bank applies hedge accounting where there is an identifiable, one-to-one relationship between a hedging derivative instrument and a hedged cash instrument. These relationships predominantly arise within the context of the Bank’s borrowing activities in which the Bank’s issued bonds are combined with swaps to achieve floating-rate debt in the currency sought by the Bank. While such hedges are matched in cash flow terms, accounting rules may require different valuation methodologies to be applied to such cash flows. Such differences can create hedge ineffectiveness or hedge failures under IFRS, the combined effect of which is reported within this line of the income statement.
One example of such a difference is a pricing component of currency swaps known as the basis swap spread, which is not applied to the related hedged bond. This component is a feature of supply and demand requirements for other currencies relative to the US dollar or the euro. Following the implementation of IFRS 9 hedge accounting rules in 2018, movements in hedging swap valuations attributable to this factor are now recognised in the statement of other comprehensive income, rather than in the statement of profit or loss as was formerly the case under IAS 39.
During the year fair value movements on one-to-one hedging relationships resulted in a loss of €29 million, comprising losses of €599 million on the derivative hedging instruments and gains of €570 million on the hedged items (2017: a gain of €13 million comprising gains of €85 million on the derivative hedging instruments and losses of €72 million on the hedged items).
In addition to the one-to-one hedge relationships for which the Bank applies hedge accounting, the Bank also hedges interest rate risk across total assets and liabilities on a portfolio basis, for which hedge accounting is not applied. This activity results in the gains or losses arising on the hedging derivative instruments being recognised in the periods in which they occur while the offsetting impact deriving from the hedged cash instruments will accrue over a different timescale in keeping with the interest rates applicable to the specific periods for those instruments. For the year this resulted in a gain of €50 million (2017: loss of €33 million).
The combined effect of all the hedging activities described above was a gain of €21 million for the year (2017: loss of €20 million).
Cash flow hedges
The Bank hedges on an annual basis to minimise the exchange rate risk associated with incurring administrative expenses in pound sterling. In 2018 no gain or loss was recognised as ineffectiveness in the income statement arising from cash flow hedges, as was the case in 2017.
10. Provisions for impairment of Banking loan investments at amortised cost74
| Charge for the year | 2018 € million | 2017 € million |
| Portfolio provisions for unidentified impairment of loan investments at amortised cost | (12) | 13 |
| Specific provisions for unidentified impairment of loan investments at amortised cost75 | (175) | (16) |
| Associated hedging costs76 | (1) | – |
| Provisions for impairment of Banking loan investments at amortised cost | (188) | (3) |
| Provisions for impairment of Banking loan investments at fair value through other comprehensive income | (4) | – |
| Provisions for impairment of Banking loan investments | (192) | (3) |
| Movement in provisions | 2018 € million | 2017 € million |
| At 1 January | (850) | (1,044) |
| Effect of adoption of IFRS 9 | (47) | – |
| At 1 January as restated | (897) | – |
| Charge for the year to the income statement77 | (188) | (3) |
| Reversal of accrued interest income on newly impaired loans | 4 | 2 |
| Unwinding of the discount relating to identified impairment of assets | 21 | 16 |
| Foreign exchange adjustments | (11) | 64 |
| Release against amounts written off | 91 | 115 |
| Recovery against amounts written off | (1) | – |
| At 31 December | (981) | (850) |
| Analysed between | ||
| Provisions for unidentified impairment of non-sovereign loan investments at amortised cost | (288) | (230) |
| Provisions for unidentified impairment of sovereign loan investments at amortised cost | (18) | (18) |
| Specific provisions for identified impairment of loan investments at amortised cost | (675) | (602) |
| At 31 December | (981) | (850) |
For the purpose of calculating impairment in accordance with IFRS 9, loans at amortised cost are grouped in three stages.
- Stage 1: Loans are originated in Stage 1. In this stage impairment is calculated on a portfolio basis and equates to the expected credit loss from these assets over a 12-month horizon.
- Stage 2: Loans for which there has been a significant increase in credit risk since inception, but which are still performing loans are grouped in Stage 2. In this stage impairment is calculated on a portfolio basis and equates to the full life expected credit loss from these assets.
- Stage 3: Loans for which there is specific evidence of impairment are grouped in Stage 3. In this stage the lifetime expected credit loss is specifically calculated for each individual asset.
Set out below is an analysis of the movements in the Banking loan investments and the associated impairment provisions for each of the stages of impairment. As these categories did not exist under IAS 39, there are no comparative tables for 2017.
| Movement in provisions | 12-month ECL (Stage 1) 2018 € million | Lifetime ECL (Stage 2) 2018 € million | Lifetime ECL (Stage 3) 2018 € million | Total 2018 € million |
| At 1 January | 181 | 114 | 602 | 897 |
| New loans originated | 51 | – | – | 51 |
| Transfer to Stage 1 | 12 | (30) | – | (18) |
| Transfer to Stage 2 – significant increase in credit risk | (18) | 94 | – | 76 |
| Transfer to Stage 3 – credit impaired | (1) | (45) | 231 | 185 |
| ECL release – repayments/settlements | (16) | (17) | (80) | (113) |
| ECL release – write offs | – | – | (91) | (91) |
| Changes in model or risk parameters | (18) | (2) | 1 | (19) |
| Foreign exchange and other movements | 2 | (1) | 12 | 13 |
| At 31 December | 193 | 113 | 675 | 981 |
| Movement in loans at amortised cost | Loans Stage 1 2018 € million | Loans Stage 2 2018 € million | Loans Stage 3 2018 € million | Total 2018 € million |
| At 1 January | 17,981 | 2,622 | 848 | 21,451 |
| New banking loans originated | 6,918 | – | – | 6,918 |
| Transfer to Stage 1 | 932 | (932) | – | – |
| Transfer to Stage 2 – significant increase in credit risk | (1,354) | 1,354 | – | – |
| Transfer to Stage 3 – credit impaired | (74) | (422) | 496 | – |
| Repayments/settlements | (5,291) | (605) | (135) | (6,031) |
| Write offs | – | – | (91) | (91) |
| Remeasurement of previously impaired loans | 9 | – | – | 9 |
| Foreign exchange and other movements | 123 | 17 | 17 | 157 |
| At 31 December | 19,244 | 2,034 | 1,135 | 22,413 |
11. General administrative expenses
| 2018 € million | 2017 € million |
|
| Personnel costs | (276) | (274) |
| Overhead expenses | (119) | (125) |
| General administrative expenses | (395) | (399) |
| Deferral of direct costs related to loan origination | 4 | 4 |
| Net general administrative expenses | (391) | (395) |
The Bank’s expenses are predominantly incurred in pound sterling. The pound sterling equivalent of the Bank’s general administrative expenses, excluding depreciation and amortisation, totalled £348 million (2017: £345 million).
The following fees for work performed by the Bank’s external auditor were included in overhead expenses:
| Audit and assurance services | 2018 € 000 | 2017 € 000 |
| Services as auditor of the Bank | (299) | (295) |
| Internal controls framework assurance | (142) | (140) |
| Retirement plan audit | (24) | (24) |
| Tax recovery audit | – | (11) |
| Audit and assurance services | (465) | (470) |
12. Placements with and advances to credit institutions
| Analysed between | 2018 € million | 2017 € million |
| Cash and cash equivalents | 5,544 | 6,271 |
| Other current placements and advances | 10,470 | 8,334 |
| At 31 December | 16,014 | 14,605 |
Cash and cash equivalents are those placements and advances which have an original tenor equal to, or less than, three months. “Current” is defined as those assets maturing, or liabilities due, within the next 12 months. All other assets or liabilities are “non-current”.
13. Debt securities
| 2018 € million | 2017 € million |
|
| Debt securities at fair value through profit or loss | 1,604 | 916 |
| Debt securities at amortised cost | 11,343 | 9,465 |
| At 31 December | 12,947 | 10,381 |
| Analysed between | ||
| Current | 4,091 | 3,061 |
| Non-current | 8,856 | 7,320 |
| At 31 December | 12,947 | 10,381 |
There were no impairment losses relating to debt securities in 2018 (2017: €nil).
14. Other financial assets
| 2018 € million | 2017 € million |
|
| Fair value of derivatives designated as fair value hedges | 2,923 | 2,891 |
| Fair value of derivatives designated as cash flow hedges | 2 | 1 |
| Fair value of portfolio derivatives not designated as hedges | 524 | 330 |
| Fair value of derivatives held in relation to the banking portfolio | 499 | 455 |
| Interest receivable | 255 | 217 |
| Paid-in capital receivable | 7 | 10 |
| Other | 119 | 125 |
| At 31 December | 4,329 | 4,029 |
| Analysed between | ||
| Current | 793 | 1,061 |
| Non-current | 3,536 | 2,968 |
| At 31 December | 4,329 | 4,029 |
15. Banking loan investments at amortised cost
| 2018 Sovereign loans € million | 2018 Non-sovereign loans € million | 2018 Total loans € million | 2017 Sovereign loans € million | 2017 Non-sovereign loans € million | 2017 Total loans € million |
|
| At 1 January | 4,071 | 18,559 | 22,630 | 4,019 | 18,993 | 23,012 |
| Effect of adoption of IFRS 978 | – | (1,179) | (1,179) | |||
| At 1 January as restated | 4,071 | 17,380 | 21,451 | |||
| Movement in fair value revaluation79 | – | – | – | – | (3) | (3) |
| Disbursements | 1,092 | 5,826 | 6,918 | 1,477 | 7,027 | 8,504 |
| Repayments and prepayments | (795) | (5,236) | (6,031) | (1,327) | (6,210) | (7,537) |
| Remeasurement of previously impaired loans | – | 9 | 9 | – | 30 | 30 |
| Foreign exchange movements | 53 | 76 | 129 | (96) | (1,123) | (1,219) |
| Movement in effective interest rate adjustment | (45) | 55 | 10 | (2) | (8) | (10) |
| Reclassification | – | 18 | 18 | – | (32) | (32) |
| Written off | – | (91) | (91) | – | (115) | (115) |
| At 31 December | 4,376 | 18,037 | 22,413 | 4,071 | 18,559 | 22,630 |
| Impairment at 31 December | (18) | (963) | (981) | (18) | (832) | (850) |
| Total net of impairment at 31 December | 4,358 | 17,074 | 21,432 | 4,053 | 17,727 | 21,780 |
| Analysed between | ||||||
| Current | 3,000 | 2,854 | ||||
| Non-current | 18,432 | 18,926 | ||||
| Total net of impairment at 31 December | 4,358 | 17,074 | 21,432 | 4,053 | 17,727 | 21,780 |
| At 31 December 2018 the Bank categorised 82 loan investments at amortised cost as impaired, with operating assets totalling €1,135 million (2017: 86 loans totalling €848 million). Specific provisions on these assets amounted to €675 million (2017: €602 million). | ||||||
16. Banking loan investments at fair value through other comprehensive income
| Non-sovereign loans | 2018 € million | 2017 € million |
| At 1 January | – | – |
| Effect of adoption of IFRS 980 | 1,190 | – |
| At 1 January as restated | 1,190 | – |
| Movement in fair value revaluation | (17) | – |
| Movement in expected credit loss | (4) | |
| Disbursements | 792 | – |
| Repayments and prepayments | (190) | – |
| Foreign exchange movements | (16) | – |
| Reclassification | (18) | – |
| At 31 December | 1,737 | – |
| Analysed between | ||
| Current | 110 | – |
| Non-current | 1,627 | – |
| Total net of impairment at 31 December | 1,737 | – |
| At 31 December 2018 the Bank categorised no loan investments at fair value through other comprehensive income as non-performing. | ||
17. Banking loan investments at fair value through profit or loss
| Non-sovereign loans | 2018 € million | 2017 € million |
| At 1 January | 372 | 313 |
| Movement in fair value revaluation | 19 | 21 |
| Disbursements | 132 | 106 |
| Repayments and prepayments | (62) | (56) |
| Foreign exchange movements | 15 | (23) |
| Reclassification | – | 32 |
| Written off | (16) | (21) |
| At 31 December | 460 | 372 |
| Analysed between | ||
| Current | 45 | 19 |
| Non-current | 415 | 353 |
| At 31 December | 460 | 372 |
18. Share investments at fair value through profit or loss
| 2018 Fair value Unlisted € million | 2018 Fair value Listed € million | 2018 Fair value Total € million | 2017 Fair value Unlisted € million | 2017 Fair value Listed € million | 2017 Fair value Total € million |
|
| Outstanding disbursements | ||||||
| At 1 January | 3,826 | 1,680 | 5,506 | 4,238 | 1,896 | 6,134 |
| Transfer between unlisted and listed | – | – | – | (76) | 76 | – |
| Disbursements | 319 | 412 | 731 | 379 | 140 | 519 |
| Disposals | (577) | (124) | (701) | (715) | (432) | (1,147) |
| Written off | – | (9) | (9) | – | – | – |
| At 31 December | 3,568 | 1,959 | 5,527 | 3,826 | 1,680 | 5,506 |
| Fair value adjustment | ||||||
| At 1 January | (761) | 89 | (672) | (1,080) | 211 | (869) |
| Transfer between unlisted and listed | – | – | – | 28 | (28) | – |
| Movement in fair value revaluation | 165 | (275) | (110) | 291 | (94) | 197 |
| At 31 December | (596) | (186) | (782) | (761) | 89 | (672) |
| Fair value at 31 December | 2,972 | 1,773 | 4,745 | 3,065 | 1,769 | 4,834 |
Summarised financial information on share investments where the Bank owned greater than, or equal to, 20 per cent of the investee share capital at 31 December 2018 (venture capital associates), is detailed in note 30.
19. Treasury share investments at fair value through other comprehensive income
Treasury holds two strategic share investments for the purposes of accessing hedging and risk management products in the currencies of less developed markets. These are in the Currency Exchange Fund N.V. and the Frontier Clearing Fund. The Bank also has a purely nominal shareholding in SWIFT as membership is required to participate in this international payments system.
| Share investment designated at fair value through other comprehensive income | 2018 € million | 2017 € million |
| The Currency Exchange Fund N.V. | 68 | 69 |
| The Frontier Clearing Fund | 7 | 7 |
| SWIFT | – | – |
| At 31 December | 75 | 76 |
| No dividend income was received on these share investments during 2018 (2017: €nil). | ||
20. Intangible assets
| Computer software development costs 2018 € million | Computer software development costs 2017 € million |
|
| Cost | ||
| At 1 January | 129 | 115 |
| Additions | 17 | 14 |
| Disposals | (1) | – |
| At 31 December | 145 | 129 |
| Amortisation | ||
| At 1 January | (67) | (52) |
| Charge | (16) | (15) |
| Disposals | – | – |
| At 31 December | (83) | (67) |
| Net book value at 31 December | 62 | 62 |
21. Property, technology and equipment
| Property 2018 € million | Property under construction 2018 € million | Technology and equipment 2018 € million | Other 2018 € million | Total 2018 € million | Property 2017 € million | Property under construction 2017 € million | Technology and equipment 2017 € million | Other 2017 € million | Total 2017 € million |
|
| Cost | ||||||||||
| At 1 January | 78 | 2 | 19 | 18 | 117 | 77 | – | 18 | – | 95 |
| Additions | 6 | – | 2 | 1 | 9 | 1 | 2 | 1 | 18 | 22 |
| Transfers | 2 | (2) | – | – | – | – | – | – | – | – |
| Disposals | (1) | – | (1) | – | (2) | – | – | – | – | – |
| At 31 December | 85 | – | 20 | 19 | 124 | 78 | 2 | 19 | 18 | 117 |
| Depreciation | ||||||||||
| At 1 January | (46) | – | (15) | (2) | (63) | (39) | – | (13) | – | (52) |
| Charge | (9) | – | (2) | (2) | (13) | (7) | – | (2) | (2) | (11) |
| Disposals | – | – | 2 | – | 2 | – | – | – | – | – |
| At 31 December | (55) | – | (15) | (4) | (74) | (46) | – | (15) | (2) | (63) |
| Net book value at 31 December | 30 | – | 5 | 15 | 50 | 32 | 2 | 4 | 16 | 54 |
22. Borrowings
| 2018 € million | 2017 € million |
|
| Amounts owed to credit institutions and other third parties | ||
| Amounts owed to credit institutions | (461) | (431) |
| Amounts held as collateral | (962) | (1,393) |
| Amounts managed on behalf of third parties81 | (684) | (826) |
| At 31 December | (2,107) | (2,650) |
| Of which current: | (2,085) | (2,627) |
23. Debts evidenced by certificates
The Bank’s outstanding debts evidenced by certificates are summarised below by currency. A significant proportion of the Bank’s debts evidenced by certificates are hedged in a one-to-one hedging relationship with a cross-currency swap. On these bond issuances, as the bond’s cash flows are offset by equivalent cash flows on the swap, the Bank’s funding costs are effectively incurred in the currency of the funding leg of the swap. The table below therefore also presents the outstanding debts evidenced by certificates by currency after factoring in these currency hedges.
| Bond denominations 2018 € million | Currency after swap 2018 € million | Bond denominations 201782 € million | Currency after swap 2017 € million |
|
| Australian dollar | (1,062) | (298) | (830) | (42) |
| Brazilian real | (839) | – | (1,133) | – |
| Euro | (3,774) | (4,243) | (2,975) | (5,663) |
| Indonesian rupiah | (1,197) | – | (926) | – |
| Indian rupee | (683) | – | (782) | – |
| Kazakh tenge | (587) | (522) | (636) | (554) |
| New Turkish lira | (2,032) | – | (920) | – |
| Pound sterling | (3,489) | (1,824) | (2,005) | (1,132) |
| United States dollar | (24,599) | (33,169) | (22,196) | (27,310) |
| Other currencies | (2,467) | (673) | (2,713) | (415) |
| At 31 December | (40,729) | (40,729) | (35,116) | (35,116) |
Where the swap counterparty exercises a right to terminate the hedging swap prior to legal maturity, the Bank is committed to exercise the same right with its issued bond.
| Analysed between | 2018 € million | 2017 € million |
| Current | (15,044) | (12,348) |
| Non-current | (25,685) | (22,768) |
| Debts evidenced by certificates at 31 December | (40,729) | (35,116) |
During the year the Bank redeemed €340 million of bonds and medium-term notes prior to maturity (2017: €170 million), generating a net gain of €1 million (2017: €nil).
The table below provides a reconciliation of the movements in debts evidenced by certificates for the year ended 31 December 2018, including both changes arising from cash flows and non-cash changes.
| For the year ended 31 December 2018 | 2017 € million | Cash flows € million | Fair value movements € million | Foreign exchange movements € million | Deals pending settlement € million | 2018 € million |
| Debts evidenced by certificates | 35,116 | 4,697 | (289) | 1,205 | – | 40,729 |
| 2016 € million | Cash flows € million | Fair value movements € million | Foreign exchange movements € million | Deals pending settlement € million | 2017 € million |
|
| Debts evidenced by certificates | 35,531 | 2,752 | 501 | (3,622) | (46) | 35,116 |
24. Other financial liabilities
| 2018 € million | 2017 € million |
|
| Fair value of derivatives designated as fair value hedges | (1,680) | (1,355) |
| Fair value of portfolio derivatives not designated as hedges | (300) | (392) |
| Fair value of other derivatives held in relation to the banking portfolio | (99) | (77) |
| Interest payable | (308) | (171) |
| Amounts payable to the Equity Participation Fund | (111) | (42) |
| Other | (234) | (218) |
| At 31 December | (2,732) | (2,255) |
| Analysed between | ||
| Current | (911) | (898) |
| Non-current | (1,821) | (1,357) |
| At 31 December | (2,732) | (2,255) |
25. Subscribed capital
| 2018 Number of shares | 2018 Total € million | 2017 Number of shares € million | 2017 Total € million |
|
| Authorised shared capital | 3,000,000 | 30,000 | 3,000,000 | 30,000 |
| of which | ||||
| Subscribed capital | 2,974,279 | 29,743 | 2,972,307 | 29,723 |
| Unsubscribed capital | 25,721 | 257 | 27,693 | 277 |
| At 31 December | 3,000,000 | 30,000 | 3,000,000 | 30,000 |
The Bank’s capital stock is divided into paid-in shares and callable shares. Each share has a par value of €10,000. At the Bank’s Annual Meeting in May 2010, the Board of Governors approved a two-step increase in the authorised capital stock of the Bank: a €1.0 billion increase in authorised paid-in shares and a €9.0 billion increase in authorised callable capital shares, amounting to a €10.0 billion aggregate increase in the authorised capital stock of the Bank (collectively referred to as the second capital increase). Resolution No. 126 authorised the increase in authorised capital stock by 100,000 paid-in shares, each share having a par value of €10,000, taking the authorised capital stock of the Bank to €21.0 billion. Resolution No. 128 authorised the increase in the authorised capital stock of the Bank by 900,000 callable shares, each share having a par value of €10,000. These shares were originally subject to redemption in accordance with the terms of Resolution No. 128, but such provisions were removed under the terms of Resolution No. 183 approved by the Board of Governors at the 2015 Annual Meeting. The increase in callable capital became effective in April 2011.
Payment for the paid-in shares issued as part of the original authorised capital stock, and as part of the first capital increase and subscribed to by members, was made over a period of years determined in advance. Payment for the paid-in shares issued under the second capital increase was by way of a reallocation of net income previously allocated to surplus for other purposes, namely for the payment of such paid-in shares, pursuant to Article 36.1 of the Agreement and approved by Board of Governors Resolution No. 126, dated 14 May 2010. Article 6.4 of the Agreement states that payment of the amount subscribed to the callable capital is subject to call by the Bank, taking account of Articles 17 and 42 of the Agreement, only as and when required by the Bank to meet its liabilities. Article 42.1 states that in the event of the termination of the Bank’s operations, the liability of all members for all uncalled subscriptions to the capital stock will continue until all claims of creditors, including all contingent claims, have been discharged.
The Agreement allows for a member to withdraw from the Bank, in which case the Bank is required to repurchase the former member’s shares. No member has ever withdrawn its membership. The stability in the membership reflects the fact that the members are 67 countries and two inter-governmental organisations, and that the purpose of the Bank is to foster the transition process in politically qualifying economies from central Europe to Central Asia and the SEMED region.
Moreover, there is a financial disincentive to withdrawing membership. The upper limit of the amount of the repurchase price of the former member’s shares is the amount of its paid-in capital, yet a former member remains liable for its direct obligations and its contingent liabilities to the Bank for as long as any part of the loans, share investments or guarantees contracted before it ceased to be a member are outstanding. Were a member to withdraw from the Bank, the Bank would be able to impose conditions and set dates in respect of payments for shares repurchased. If, for example, paying a former member would have adverse consequences for the Bank’s financial position, the Bank could defer payment until the risk had passed, and indefinitely if appropriate. If a payment was then made to a former member, the member would be required to repay, on demand, the amount by which the repurchase price would have been reduced if the losses for which the former member remained liable had been taken into account at the time of payment.
Under the Agreement, payment for the paid-in shares of the initial capital stock subscribed to by members was made in five equal annual instalments. Of each instalment, up to 50 per cent was payable in non-negotiable, non-interest-bearing promissory notes or other obligations issued by the subscribing member and payable to the Bank at par value upon demand. Under Resolution No. 59, payment for the paid-in shares subscribed to by members under the first capital increase was made in eight equal annual instalments. Under Resolution No. 126, payment for the paid-in shares issued to members under the second capital increase was made in one instalment immediately following approval of Resolution No. 126.
On 5 July 2018, Egypt increased its subscription to the Bank’s capital stock by 986 shares (807 callable shares and 179 paid-in shares). A capital contribution of €1.79 million was made for the paid-in shares.
On 11 July 2018, India was admitted to membership of the Bank, subscribing to 986 shares of the Bank’s capital stock (807 callable shares and 179 paid-in shares). A capital contribution of €1.79 million was made for the paid-in shares.
A statement of capital subscriptions showing the amount of paid-in and callable shares subscribed to by each member, together with the number of votes, is set out in the following table. Under Article 29 of the Agreement, the voting rights of members that have failed to pay any part of the amounts due in respect of their capital subscription are proportionately reduced until payment is made.
Statement of capital subscriptions
| At 31 December 2018 Members | Total shares (number) | Resulting votes83 (number) | Total capital € million | Callable capital € million | Paid-in capital € million |
| Albania | 3,001 | 3,001 | 30.01 | 23.75 | 6.26 |
| Armenia | 1,499 | 1,499 | 14.99 | 11.86 | 3.13 |
| Australia | 30,014 | 30,014 | 300.14 | 237.54 | 62.6 |
| Austria | 68,432 | 68,432 | 684.32 | 541.59 | 142.73 |
| Azerbaijan | 3,001 | 3,001 | 30.01 | 23.75 | 6.26 |
| Belarus | 6,002 | 6,002 | 60.02 | 47.5 | 12.52 |
| Belgium | 68,432 | 68,432 | 684.32 | 541.59 | 142.73 |
| Bosnia and Herzegovina | 5,071 | 5,071 | 50.71 | 40.14 | 10.57 |
| Bulgaria | 23,711 | 23,711 | 237.11 | 187.65 | 49.46 |
| Canada | 102,049 | 102,049 | 1,020.49 | 807.64 | 212.85 |
| China | 2,900 | 2,900 | 29 | 23.75 | 5.25 |
| Croatia | 10,942 | 10,942 | 109.42 | 86.6 | 22.82 |
| Cyprus | 3,001 | 3,001 | 30.01 | 23.75 | 6.26 |
| Czech Republic | 25,611 | 25,611 | 256.11 | 202.69 | 53.42 |
| Denmark | 36,017 | 36,017 | 360.17 | 285.05 | 75.12 |
| Egypt | 3,087 | 3,087 | 30.87 | 22.82 | 8.05 |
| Estonia | 3,001 | 3,001 | 30.01 | 23.75 | 6.26 |
| European Investment Bank | 90,044 | 90,044 | 900.44 | 712.63 | 187.81 |
| European Union | 90,044 | 90,044 | 900.44 | 712.63 | 187.81 |
| Finland | 37,518 | 37,518 | 375.18 | 296.92 | 78.26 |
| FYR Macedonia84 | 1,762 | 1,762 | 17.62 | 13.31 | 4.31 |
| France | 255,651 | 255,651 | 2,556.51 | 2,023.28 | 533.23 |
| Georgia | 3,001 | 3,001 | 30.01 | 23.75 | 6.26 |
| Germany | 255,651 | 255,651 | 2,556.51 | 2,023.28 | 533.23 |
| Greece | 19,508 | 19,508 | 195.08 | 154.39 | 40.69 |
| Hungary | 23,711 | 23,711 | 237.11 | 187.65 | 49.46 |
| Iceland | 3,001 | 3,001 | 30.01 | 23.75 | 6.26 |
| India | 986 | 986 | 9.86 | 8.07 | 1.79 |
| Ireland | 9,004 | 9,004 | 90.04 | 71.26 | 18.78 |
| Israel | 19,508 | 19,508 | 195.08 | 154.39 | 40.69 |
| Italy | 255,651 | 255,651 | 2,556.51 | 2,023.28 | 533.23 |
| Japan | 255,651 | 255,651 | 2,556.51 | 2,023.28 | 533.23 |
| Jordan | 986 | 986 | 9.86 | 8.07 | 1.79 |
| Kazakhstan | 6,902 | 6,902 | 69.02 | 54.62 | 14.4 |
| Republic of Korea | 30,014 | 30,014 | 300.14 | 237.54 | 62.6 |
| Kosovo | 580 | 580 | 5.8 | 4.75 | 1.05 |
| Kyrgyz Republic | 2,101 | 1,010 | 21.01 | 14.75 | 6.26 |
| Latvia | 3,001 | 3,001 | 30.01 | 23.75 | 6.26 |
| Lebanon | 986 | 986 | 9.86 | 8.07 | 1.79 |
| Liechtenstein | 599 | 599 | 5.99 | 4.74 | 1.25 |
| Lithuania | 3,001 | 3,001 | 30.01 | 23.75 | 6.26 |
| Luxembourg | 6,002 | 6,002 | 60.02 | 47.5 | 12.52 |
| Malta | 210 | 210 | 2.1 | 1.47 | 0.63 |
| Mexico | 4,501 | 4,501 | 45.01 | 34.5 | 10.51 |
| Moldova | 3,001 | 3,001 | 30.01 | 23.75 | 6.26 |
| Mongolia | 299 | 299 | 2.99 | 2.36 | 0.63 |
| Montenegro | 599 | 599 | 5.99 | 4.74 | 1.25 |
| Morocco | 2,464 | 2,464 | 24.64 | 19.35 | 5.29 |
| Netherlands | 74,435 | 74,435 | 744.35 | 589.1 | 155.25 |
| New Zealand | 1,050 | 1,050 | 10.5 | 7 | 3.5 |
| Norway | 37,518 | 37,518 | 375.18 | 296.92 | 78.26 |
| Poland | 38,418 | 38,418 | 384.18 | 304.05 | 80.13 |
| Portugal | 12,605 | 12,605 | 126.05 | 99.76 | 26.29 |
| Romania | 14,407 | 14,407 | 144.07 | 114.02 | 30.05 |
| Russian Federation | 120,058 | 120,058 | 1,200.58 | 950.17 | 250.41 |
| Serbia | 14,031 | 14,031 | 140.31 | 111.05 | 29.26 |
| Slovak Republic | 12,807 | 12,807 | 128.07 | 101.36 | 26.71 |
| Slovenia | 6,295 | 6,295 | 62.95 | 49.82 | 13.13 |
| Spain | 102,049 | 102,049 | 1,020.49 | 807.64 | 212.85 |
| Sweden | 68,432 | 68,432 | 684.32 | 541.59 | 142.73 |
| Switzerland | 68,432 | 68,432 | 684.32 | 541.59 | 142.73 |
| Tajikistan | 2,101 | 1,106 | 21.01 | 14.75 | 6.26 |
| Tunisia | 986 | 986 | 9.86 | 8.07 | 1.79 |
| Turkey | 34,515 | 34,515 | 345.15 | 273.16 | 71.99 |
| Turkmenistan | 210 | 210 | 2.1 | 1.47 | 0.63 |
| Ukraine | 24,011 | 24,011 | 240.11 | 190.03 | 50.08 |
| United Kingdom | 255,651 | 255,651 | 2,556.51 | 2,023.28 | 533.23 |
| United States of America | 300,148 | 300,148 | 3,001.48 | 2,375.44 | 626.04 |
| Uzbekistan | 4,412 | 4,412 | 44.12 | 30.97 | 13.15 |
| Capital subscribed by members | 2,974,279 | 2,972,193 | 29,742.79 | 23,528.24 | 6,214.55 |
26. Reserves and retained earnings
| 2018 € million | 2017 € million |
|
| Special reserve | ||
| At 1 January | 306 | 306 |
| At 31 December | 306 | 306 |
| Loan loss reserve | ||
| At 1 January | 1,219 | 1,171 |
| Transferred (to)/from retained earnings | (706) | 48 |
| At 31 December | 513 | 1,219 |
| Net income allocation | ||
| At 1 January | 8 | 9 |
| Transferred from retained earnings | 130 | 180 |
| Distributions | (130) | (181) |
| At 31 December | 8 | 8 |
| General reserve – other reserve | ||
| Revaluation reserve | ||
| At 1 January | 20 | 19 |
| Effect of adoption of IFRS 985 | 16 | – |
| At 1 January as restated | 36 | – |
| Net losses arising on revaluation of loan investments at fair value through other comprehensive income | (17) | – |
| Net (losses)/gains arising on revaluation of share investments at fair value through other comprehensive income | (1) | 1 |
| At 31 December | 18 | 20 |
| Hedging reserve – cash flow hedges | ||
| At 1 January | 1 | (2) |
| Losses from changes in fair value of fair value hedges recognised in equity | (46) | – |
| Gains from changes in fair value of cash flow hedges recognised in equity | 1 | 3 |
| At 31 December | (44) | 1 |
| Other | ||
| At 1 January | 231 | 225 |
| Internal tax for the year | 6 | 6 |
| At 31 December | 237 | 231 |
| General reserve – other reserve at 31 December | 211 | 252 |
| General reserve – retained earnings | ||
| At 1 January | 8,176 | 7,623 |
| Effect of adoption of IFRS 986 | (52) | – |
| At 1 January as restated | 8,124 | – |
| Net profit before transfers of net income approved by the Board of Governors | 340 | 772 |
| Transferred to loan loss reserve | 706 | (48) |
| Transferred to net income allocation | (130) | (179) |
| Actuarial gains on defined benefit scheme | (10) | 8 |
| General reserve retained earnings at 31 December | 9,030 | 8,176 |
| Total reserves and retained earnings at 31 December | 10,068 | 9,961 |
The special reserve is maintained, in accordance with Article 16 of the Agreement, for meeting certain defined losses of the Bank. The special reserve has been established, in accordance with the Bank’s financial policies, by setting aside 100 per cent of qualifying fees and commissions received by the Bank associated with loans, guarantees and underwriting the sale of securities. In 2011 the Board of Directors decided that for the foreseeable future the size of the special reserve was adequate.
In 2005, the Bank created a loan loss reserve (LLR) within members’ equity, to set aside an amount of retained earnings equal to the difference between the impairment losses expected over the life of the loan portfolio and the amount recognised on the Bank’s balance sheet in accordance with IFRS impairment rules. In 2015 in a one-off allocation of €660 million was moved to the LLR. Following a period of more stable economic conditions, it was agreed during 2017 that this additional allocation would be released in full as of 1 January 2018. Excluding the release of €660 million, the LLR decreased by €46 million (2017: increase of €48 million), in part as a result of the adoption of IFRS 9 impairment increasing the proportion of expected losses recognised on the balance sheet.
The general reserve represents all reserves except those amounts allocated to the special and loan loss reserves and it primarily comprises retained earnings. It also includes the retention of internal tax paid in accordance with Article 53 of the Agreement. This requires that all Directors, Alternate Directors, officers and employees of the Bank are subject to an internal tax imposed by the Bank on salaries and emoluments paid by the Bank and which is retained for its benefit. At the end of the year internal tax amounted to €128 million (2017: €122 million).
The hedging reserve includes foreign exchange revaluation amounts on designated hedging instruments held by the Bank for the purposes of hedging its estimated future pound sterling operating expenditure. At 31 December 2018 there was a gain of €2 million on these hedges. Revaluation gains or losses on these hedges are held in reserves until the related hedged expenditure is incurred at which time such gains or losses are released to profit or loss. Following the adoption of IFRS 9, the reserve also includes valuation adjustments on designated hedging instruments held by the Bank as fair value hedges that are attributable to movements in foreign currency basis spreads. These deferred gains or losses will be released from reserves over the remaining life of the underlying hedging instruments. At 31 December 2018 there was a deferred loss of €46 million on these hedging instruments.
| Reserves and retained earnings | 2018 € million | 2017 € million |
| Special reserve | 306 | 306 |
| Loan loss reserve | 513 | 1,219 |
| Net income allocation | 8 | 8 |
| Unrealised gains | 1,234 | 1,162 |
| Total restricted reserves | 2,061 | 2,695 |
| Unrestricted general reserves | 8,007 | 7,266 |
| At 31 December | 10,068 | 9,961 |
The Bank’s reserves are used to determine, in accordance with the Agreement, what part of the Bank’s net income will be allocated to surplus or other purposes and what part, if any, will be distributed to its members. For this purpose, the Bank uses unrestricted general reserves.
Article 36 of the Agreement relates to the allocation and distribution of the Bank’s net income and states: “No such allocation, and no distribution, shall be made until the general reserve amounts to at least ten per cent of the authorised capital stock”. This figure is currently €3.0 billion (2017: €3.0 billion).
During 2018, the Board of Governors approved the transfer of €130 million of net income to be allocated to other purposes. This amount was reflected in the 2018 income statement, below net profit from continuing operations. Under Resolution No. 214: 2017 Net Income Allocation, €110 million was allocated to the EBRD Shareholder Special Fund (including an amount of €15 million required to support the Bank’s specific operational response for refugee-hosting countries), €20 million was allocated as a contribution to the EBRD Trust Fund for the West Bank and Gaza.
27. Undrawn commitments and guarantees
| Analysis by instrument | 2018 € million | 2017 € million |
| Undrawn commitments | ||
| Loans | 10,802 | 10,692 |
| Share investments | 1,378 | 1,283 |
| At 31 December | 12,180 | 11,975 |
| Guarantees | ||
| Trade finance guarantees | 797 | 694 |
| Other guarantees | 91 | 101 |
| At 31 December | 888 | 795 |
| Undrawn commitments and guarantees at 31 December | 13,068 | 12,770 |
28. Operating lease commitments
The Bank leases its Headquarters building in London and all of its Resident Office buildings in the economies in which it invests. These are standard operating leases and include renewal options, periodic escalation clauses and are mostly non-cancellable in the normal course of business without the Bank incurring substantial penalties with the exception of the Headquarters lease. The most significant lease is that for the Bank’s Headquarters building. Rent payable under the terms of this lease is reviewed every five years and is based on market rates. The most recent review was completed in 2016 from which there was no increase in rent. The next review is due to commence in 2021.
Minimum future lease payments under long-term non-cancellable operating leases and payments made under such leases during the year are shown below:
| Payable | 2018 € million | 2017 € million |
| Not later than one year | 28 | 29 |
| Later than one year and not later than five years | 73 | 88 |
| Later than five years | – | – |
| At 31 December | 101 | 117 |
| Expenditure incurred in the current year | 30 | 27 |
29. Staff retirement schemes
There are two retirement plans in operation. The FSP is a defined benefit scheme, to which only the Bank contributes. The MPP is a defined contribution scheme to which both the Bank and staff contribute, with Plan members making individual investment decisions. Both plans provide a lump sum benefit on leaving the Bank or at retirement age, meaning that retirement plan obligations to staff once they have left the Bank or retired are minimal (being limited to inflation adjustments on undrawn or deferred benefits under each plan).
Defined benefit scheme
A qualified actuary performs a full actuarial valuation of the FSP at least every three years using the projected unit method, with a more
high-level interim valuation performed annually. The most recent full valuation was carried out on 30 June 2017 which, for the purposes of IAS 19: Employee Benefits, was rolled forward to 31 December 2018. The present value of the defined benefit obligation and current service cost was calculated using the projected unit credit method.
The primary risk associated with the FSP is that its assets will fall short of its liabilities. This risk, encompassing market risk and credit risk associated with its investments and the liquidity risk associated with the payment of defined obligations as they fall due is borne by the Bank as the FSP is fully funded by the Bank. Responsibility for the investment strategy of the Scheme rests with the Retirement Plan Investment Committee (RPIC).
The aim of investment risk management is to minimise the risk of an overall reduction in the value of the FSP assets and to maximise the opportunity for gains across the whole investment portfolio. This is achieved through asset diversification to reduce exposure to market risk and credit risk to an acceptable level. For example, the non-cash and government bond investment holdings held by the FSP are fund-based investments that diversify their exposure to a number of underlying investments.
The RPIC passively manages credit risk by selecting investment funds that invest in gilts rather than corporate bonds. To mitigate against market risk the RPIC meets quarterly with the FSP’s investment adviser to review the performance of all of the funds against their benchmarks. No asset-liability matching strategies are undertaken in relation to the FSP.
If, at the effective date of any actuarial valuation, the value of the plan’s assets is less than the liabilities, it is the Bank’s policy to review the funding status of the FSP and decide if a recovery plan should be put in place. Typically, such a recovery plan would include either anticipated investment out-performance, additional contributions from the Bank, or both. In the event that the plan assets are estimated to have fallen below 90 per cent of the defined benefit obligation (DBO), the Bank would expect to make additional contributions to restore the funding of the plan to at least 90 per cent as soon as possible.
Amounts recognised in the balance sheet are as follows:
| 2018 € million | 2017 € million |
|
| Fair value of plan assets | 462 | 464 |
| Present value of the defined benefit obligation | (480) | (461) |
| Net defined benefit asset at 31 December | (18) | 3 |
| Movement in the net defined benefit asset (included in “Other assets”): | ||
| At 1 January | 3 | 4 |
| Contributions paid87 | 31 | 29 |
| Total expense as below | (42) | (38) |
| Remeasurement effects recognised in other comprehensive income | (10) | 8 |
| At 31 December | (18) | 3 |
| The amounts recognised in the income statement are as follows: | ||
| Current service cost | (42) | (38) |
| Total included in staff costs | (42) | (38) |
| 2018 | 2017 | |
| Discount rate | 2.55% | 2.35% |
| Expected return on plan assets | 2.55% | 2.35% |
| Price inflation | 3.25% | 3.25% |
| Future salary increases | 3.75% | 3.75% |
| Weighted average duration of the defined benefit obligation | 10 years | 12 years |
| Assumption | Sensitivity | (Decrease)/increase in DBO € million |
|
| Discount rate | 2.55% | ±0.5% pa | (23)/25 |
| Price inflation | 3.25% | ±0.25% pa | 12/(12) |
These sensitivity analyses have been determined based on reasonably possible changes of the respective assumptions occurring at the end of the reporting period, while holding all other assumptions constant. The sensitivity analysis presented above may not be representative of the actual change in the defined benefit obligation as it is unlikely that the change in assumptions would occur in isolation of one another as the assumptions may be correlated.
| Plan asset allocation | 2018 Listed € million | 2018 Unlisted € million | 2018 Total € million | 2017 Listed € million | 2017 Unlisted € million | 2017 Total € million |
| Equities | 209 | 47 | 256 | 214 | 48 | 262 |
| Index-linked bonds | 170 | – | 170 | 162 | – | 162 |
| Other | – | 36 | 36 | – | 40 | 40 |
| Fair value of plan assets | 379 | 83 | 462 | 376 | 88 | 464 |
| Changes in the present value of the defined benefit obligation are as follows: | 2018 € million | 2017 € million |
| Present value of defined benefit obligation at 1 January | (461) | (418) |
| Service cost | (42) | (38) |
| Interest cost | (11) | (10) |
| Effect of exchange rate movement | 6 | 13 |
| Actuarial gain/(loss) arising due to changes in assumptions88 | 15 | (27) |
| Benefits paid | 13 | 19 |
| Present value of defined benefit obligation at 31 December | (480) | (461) |
| Changes in the fair value of plan assets are as follows: | 2018 € million | 2017 € million |
| Present value of plan assets at 1 January | 464 | 422 |
| Interest income on plan assets | 11 | 10 |
| Return on assets (lower)/greater than discount rate | (25) | 35 |
| Effect of exchange rate movement | (6) | (13) |
| Contributions paid | 31 | 29 |
| Benefits paid | (13) | (19) |
| Present value of plan assets at 31 December | 462 | 464 |
| Experience gains and losses | 2018 € million | 2017 € million |
| Defined benefit obligation | (480) | (461) |
| Plan assets | 462 | 464 |
| (Deficit)/surplus | (18) | 3 |
| Experience losses on plan assets: | ||
| Amount | 3 | – |
| Percentage of the present value of the plan assets | 0.60% | 0% |
| Actual return less expected return on plan assets: | ||
| Amount | (25) | 35 |
| Percentage of the present value of the plan assets | (5.40%) | 7.50% |
Defined contribution scheme
The charge recognised in the income statement under the MPP was €18 million (2017: €17 million) and is included in “General administrative expenses”.
Other long-term employee benefits
The Bank maintains a medical retirement benefit plan to provide staff retiring from the Bank, aged 50 or over and with at least seven years’ service, with a lump sum benefit to help purchase medical insurance cover. The total charge for the year was €4 million (2017: €3 million).
30. Related parties
The Bank has the following related parties:
Key management personnel
Key management personnel comprise: members of the Bank’s Executive Committee, Managing Directors and the Director of the President’s Office.
Salaries and other benefits paid to key management personnel in 2018 amounted to €17 million (2017: €18 million). This comprises salary and employee benefits of €14 million (2017: €14 million) and post-employment benefits of €3 million (2017: €4 million).
In pound sterling terms, the salaries and other benefits paid to key management personnel in 2018 amounted to £16 million (2017: £16 million), comprising salary and employee benefits of £13 million (2017: £13 million) and post-employment benefits of £3 million (2017: £3 million).
Venture capital associates
The Bank has invested in a number of venture capital associates that it accounts for at fair value through profit or loss. At 31 December 2018, according to the 201789 audited financial statements (and where these are not available, the most recent unaudited management information) from the investee companies, these venture capital associates had total assets of €26.1 billion (2017: €29.5 billion) and total liabilities of €18.5 billion (2017: €21.7 billion). For the year ended 31 December 2017, these associates had income of €3.6 billion (2016: €4.3 billion) and made €1.0 billion profit before tax (2016: €0.5 billion).
In addition, as at 31 December 2018, the Bank had outstanding €9 million (2017: €17 million) of financing to these companies on which it had received no interest income during the year (2017: €1 million).
Set out below is summarised financial information for the one venture capital associate deemed material to the Bank. The information presented is based off the latest set of audited financial statements available at the time which was 31 December 2017.
| Meridiam Infrastructure Eastern Europe (SCA) SICAR | € million |
| The Bank’s ownership percentage | 25.00% |
| Principal place of business | Eastern Europe |
| Summarised balance sheet | |
| Current assets | 13 |
| Current liabilities | 2 |
| Non-current assets | 368 |
| Non-current liabilities | – |
| Summarised income statement | |
| Revenue | 39 |
| Profit or loss from continuing operations | 23 |
| Other comprehensive income | – |
| Total comprehensive income | 23 |
| Dividends | 8 |
Special Funds
Special Funds are established in accordance with Article 18 of the Agreement Establishing the Bank and are administered under the terms of the rules and regulations for each such Special Fund. At 31 December 2018 the Bank administered 18 Special Funds (2017: 18 Funds) with aggregate pledged contributions and associated fees amounting to €2.4 billion (2017: €2.1 billion).
The Bank acts as manager and administrator of the Special Funds for which it receives management and cost recovery fees. In 2018 these fees amounted to €8.8 million (2017: €12.6 million) of which €0.1 million was receivable at 31 December 2018 (2017: €0.9 million).
The Bank pays for guarantees from certain Special Funds in respect of specific exposures arising in its trade finance portfolios for which it paid €0.1 million in 2018 (2017: €0.1 million). In addition, the Bank also benefits from fee-free guarantee arrangements with certain Special Funds for losses which it could potentially incur in its investment activities. The provision of these guarantees qualifies such Special Funds as unconsolidated structured entities within the meaning of IFRS 12. The Bank’s only exposure to these Special Funds would arise in the period between recognising a guarantee receivable on its balance sheet and the settlement of that receivable.
At 31 December 2018 the Bank had €1.9 million such exposures (2017: €2.5 million).
Audit fees payable to the Bank’s auditor for the 2018 audits of the Special Funds totalled €0.1 million (2017: €0.1 million).
The financial statements of each Special Fund are approved separately by the Board of Governors at the Bank’s Annual Meeting.
Trust Funds
On 10 May 2017 the Board of Directors established the Trust Fund for the West Bank and Gaza and the Multi-Donor Trust Fund for the West Bank and Gaza in accordance with Article 20.1 (vii) of the Agreement Establishing the EBRD. The Trust Funds are governed under the terms of the rules and guidelines for each such Trust Fund.
At 31 December 2018 the total pledged contributions to the Trust Fund for the West Bank and Gaza were €50 million (2017: €30 million). The total pledged contributions to the Multi-Donor Trust Fund for the West Bank and Gaza were €0.8 million (2017: nil). This Trust Fund has not yet met the conditions to be in operation.
The Bank acts as the administrator of both Trust Funds and is entitled to management and cost recovery fees. During 2018 these fees totalled €1.3 million for the Trust Fund for the West Bank and Gaza (2017: €1.1 million), of which €0.2 million was receivable at 31 December 2018 (2017: €0.1 million).
The financial statements of the Trust Fund in operation are approved separately by the Board of Governors at the Bank’s Annual Meeting.
31. Other fund agreements
Cooperation Funds
In addition to the Bank’s ordinary operations, the Special Funds programme and the Trust Funds, the Bank administers numerous bilateral and multilateral contribution agreements to provide technical assistance and investment support grants in the existing and potential economies in which it invests. These grants focus primarily on project preparation, project implementation (including goods and works), advisory services and training. The Bank also acts as a fund manager for donor-financed grants that can be accessed by other International Finance Institutions. The Bank acts as fund manager for the following funds: Eastern Europe Energy Efficiency and Environment Partnership Funds (E5P), European Western Balkans Joint Fund (EWBJF – under the Western Balkans Investment Framework) and the Northern Dimension Environmental Partnership Fund (non-nuclear).
The resources provided through cooperation contribution agreements are held separately from the ordinary capital resources of the Bank and are typically subject to external audit when required by the agreements.
In 2018 new agreements and replenishments of €520 million (2017: €432 million) were signed with donors. Contributions of €310 million (2017: €195 million) were received, and disbursements of €160 million (2017: €131 million) paid out during the year. At 31 December 2018, the total number of open Cooperation Funds was 212 (2017: 204).
Nuclear Funds
Following a proposal by the G7 countries for a multilateral programme of action to improve safety in nuclear power plants in the economies in which the Bank invests, the Nuclear Safety Account (NSA) was established by the Bank in March 1993. The NSA funds are in the form of grants and are used for funding safety improvement measures.
At their Denver Summit in June 1997, the G7 countries and the European Union endorsed the setting up of the Chernobyl Shelter Fund (CSF). The CSF was established on 7 November 1997, when the rules of the CSF were approved by the Board of Directors. It became operational on 8 December 1997, when the required eight contributors had entered into contribution agreements with the Bank. The objective of the CSF is to assist Ukraine in transforming the existing Chernobyl sarcophagus into a safe and environmentally stable system.
In 1999, in pursuit of their policy to accede to the European Union, Lithuania, Bulgaria and the Slovak Republic gave firm commitments to close and decommission their nuclear power plant units with RBMK and VVER 440/230 reactors by certain dates. In response to this, the European Commission announced its intention to support the decommissioning of these reactors with substantial grants, and invited the Bank to administer three International Decommissioning Support Funds (IDSFs). On 12 June 2000, the Bank’s Board of Directors approved the rules of the Ignalina, Kozloduy and Bohunice IDSFs and the role of the Bank as their administrator. The funds finance selective projects to help with the decommissioning of designated reactors. They also finance measures to facilitate the necessary restructuring, upgrading and modernisation of the energy production, transmission and distribution sectors and improvements in energy efficiency.
In late 1999, the European Council launched the Northern Dimension policy as demonstration of regional cooperation. The Bank was entrusted with setting up a Northern Dimension Environmental Partnership (NDEP), as a multi-donor fund providing grant assistance to address the most pressing environmental challenges in the north-west of Russia focusing on radioactive waste, within the “nuclear window”.90 The Board of Directors adopted the Rules of the NDEP Support Fund on 10 January 2002. On 21 May 2003, the European Commission, the Russian Federation and a number of donor countries signed a framework facilitating cooperation in the area of safety of spent nuclear fuel and radioactive waste management in Russia, referred to as the “Multilateral Nuclear Environmental Programme in the Russian Federation” (MNEPR). The signing of the MNEPR was a pre-condition for entering into NDEP grant agreements and marked the beginning of operations in the NDEP nuclear safety programme.
In 2011, major donors to the NSA and CSF expressed interest in the creation, by the Bank, of an independent project monitoring function on projects undertaken by the NSA and CSF. The Chernobyl Projects Monitoring Account was established by the Bank to fulfil this interest and became operational on 29 August 2012, when the required two contributors had entered into cooperation agreements with the Bank.
In 2013 the European Commission asked the Bank to set up a multilateral fund to finance projects dealing with uranium mining legacy in Central Asia. In May 2015, the Bank’s Board of Directors approved the rules of the Environmental Remediation Account and the role of the Bank as fund manager. The Account became operational in 2016.
The table below provides a summary of Nuclear Fund contributions.
| 2018 Contributions pledged € million | 2018 Number of contributors | 2017 Contributions pledged € million | 2017 Number of contributors |
|
| Nuclear Safety Account | 427 | 17 | 403 | 17 |
| Chernobyl Shelter Fund | 1,646 | 28 | 1,646 | 28 |
| Ignalina IDSF | 778 | 15 | 778 | 15 |
| Kozloduy IDSF | 1,087 | 10 | 1,044 | 10 |
| Bohunice IDSF | 653 | 8 | 653 | 8 |
| NDEP91 | 353 | 12 | 353 | 12 |
| Chernobyl Projects Monitoring Account | 5 | 3 | 4 | 3 |
| Environmental Remediation Account | 32 | 5 | 23 | 2 |
The cash balances belonging to each of the funds in the table above are managed by the Bank on their behalf.92
Audit fees payable to the Bank’s auditor for the 2018 audits of the Cooperation and Nuclear Safety funds amounted to €0.5 million (2017: €0.5 million).
Equity Participation Fund
In 2016 the Bank set up the EBRD Equity Participation Fund LP (EPF) as part of a strategy to attract long-term institutional capital into private sector investments in the economies where the Bank invests. The EPF is a fixed-term fund (12 years) that gives investors a pre‑determined (20 per cent) holding in new EBRD direct equity investments which meet the EPF eligibility criteria. These eligibility criteria ensure that neither the EBRD nor the EPF are able to “cherry-pick” the investments in which the EPF participates. Throughout the life of the direct equity investment the EBRD retains legal ownership and control over the equity investments, albeit that the economic benefits of the participation do not accrue to the Bank. In return for the purchase price the EPF receives from the EBRD an equity return swap (ERS). The ERS is classified as a financial liability held at fair value through profit or loss93 within “Other Liabilities” and as at 31 December 2018 has a total value of €111 million (2017: €42 million). In exchange for managing the equity investments the EBRD receives a management fee. The Bank charged a management fee of €4 million in 2018 (2017: €5 million) of which none remained payable at 31 December 2018 (2017: nil). Since the EPF’s inception a total of €115 million has been invested in eight eligible investments.
32. Events after the reporting period
There have been no material events since the reporting period that would require adjustment to these financial statements.
Since 31 December 2018 observable movements in the value of the Bank’s listed equities in 2018 have resulted in an increase of approximately €94 million while movements in the exchange rate of the Russian rouble and Turkish lira have decreased the fair value of the Bank’s unlisted equity investments and associated derivatives by approximately €11 million. These gains of €83 million will be recognised in the 2019 financial statements.
At 27 March 2019 there had been no other material events after the reporting period to disclose.
On 27 March 2019 the Board of Directors reviewed the financial statements and authorised them for issue. These financial statements will be submitted for approval to the Annual Meeting of the Board of Governors to be held on 8-9 May 2019.
Footnotes
19 See note 12 for total amounts in “placements with and advances to credit institutions”.
20 The exception being the small number of Treasury share investments held at fair value through other comprehensive income as described in the next section.
21 See note 19 to the financial statements.
22 See note 31 for further details on the Equity Participation Fund.
23 OTC derivatives are those not settled through a central clearing party.
24 For the purpose of calculating impairment, origination is the trade date of the asset (that is, the signing date in the case of the Bank’s loans at amortised cost), not the date of the initial recognition of the asset on the Bank’s balance sheet.
25 See the table.
26 A project is assigned to the “watch list” when a risk officer determines that there is a heightened risk that needs to be flagged to management and Corporate Recovery of the project failing to meet debt service and the Bank subsequently suffering a financial loss.
27 The Bank’s internal PD rating scale is explained in detail of the Risk Management section.
28 See table showing probability of default ratings used by the Bank in the credit risk section under “Risk Management”.
29 See PD table above.
30 Internal ratings based.
31 The level of provision is very sensitive to an adverse move in stage allocation. This sensitivity is driven by relatively long maturity of the underlying assets, as well as the fact that around 90 per cent of the portfolio is currently in Stage 1.
32 Adjusting the PD ratings has a dual impact in that a changed PD rating results in a change in the PD rate applied in the ECL calculation, but can also lead to a change in the staging of a loan, given that a three-notch downgrade since inception is one of the Bank’s triggers for including an asset in Stage 2. Both of these effects are captured here.
33 The relatively low sensitivity to changes in GDP is due to high historical volatilities of GDP growth in the economies where the Bank invests, resulting in substantial uncertainty around GDP forecasts. This analysis of sensitivity excludes any stage transition effects that might occur in parallel to such changes in GDP forecasts.
34 With the Banking Vice-Presidency being the first line of defence in identifying and managing risks related to Banking debt and equity operations and the Treasury department being the first line of defence in identifying and managing risks related to Treasury exposure.
35 For further information on the concepts of transition impact and additionality, visit: https://www.ebrd.com/our-values.html
36 The TTC probabilities of default associated with these risk ratings are summarised in the critical accounting estimates and judgement section.
37 For more details on LGD rates see the critical accounting estimates and judgements section.
38 For further details see the accounting policies section.
39 NPL include impaired loans at amortised cost of €1.1 billion (2017: €0.8 billion), loans at fair value through profit or loss with an original cost of €41 million (2017: €49 million) and no loans at fair value through other comprehensive income (2017: nil).
40 Defined as a loan in which any of the key terms and conditions have been amended due to the financial stress of the borrower, and without such amendment(s) would be likely to have become an impaired loan.
41 Includes loans at fair value that have no associated specific provisions.
42 Does not include fair value adjustments on impaired assets carried at fair value.
43 Reduction in specific provisions due to interest income recognised.
44 The ratio is calculated by dividing specific provisions over total impaired loans at amortised cost.
45 For further information about stage assessment see the critical accounting estimates and judgements section.
46 The ratio of amortised cost impaired loans disclosed here is based on the exposure represented on the balance sheet rather than operating assets. Total NPL including fair value loans were 4.7 per cent of operating assets (2017: 3.9 per cent).
47 There were no loans classified in this category in 2017 prior to the implementation of IFRS 9 (2014). For further details see the significant accounting policies section.
48 Following notification in February 2019 from the Ministry of Foreign Affairs of the Republic of North Macedonia, in future editions of the Financial Report the country will be named North Macedonia.
49 Calculated at 99.99% confidence level and over a one-year horizon.
50 Treasury liquid assets consist of placements with and advances to credit institutions and debt securities.
51 BB+/Ba1/BB+ level or worse.
52 Where a financial liability held at amortised cost contains an embedded derivative which is of a different economic character to the host instrument, that embedded derivative is bifurcated and measured at fair value through the income statement. All such derivatives bifurcated by the Bank are embedded in Debts Evidenced by Certificates.
53 This does not include negotiated options associated with share investments.
54 Indirect exposure is not included – that is, where the Bank holds government securities as collateral.
55 Value-at-risk (VaR) is a statistical estimate of the maximum probable loss that can be incurred, due to adverse movements in major risk drivers, over a one-day trading horizon and estimated at a given confidence level. Expected shortfall (eVaR) is the average loss beyond the VaR level and is a more accurate measure of large potential losses.
56 The table reflects the currency in which shares are denominated. For most of the share investments denominated in euro (€1.87 billion) and in United States dollar (€811 million equivalent) the underlying risk exposures (and cash flows determining the equity values) are in local currency of one of the economies where the Bank invests. As a result, the overall foreign exchange risk for these exposures also includes movements between the relevant local currency and either euro or United States dollar (but which is outside the scope of this disclosure).
57 Based on a five-year rolling average movement in the exchange rate.
58 Based on a five-year rolling average movement in the relevant equity market indices.
59 Spread risk arises from cross-currency basis spreads, tenor spreads (for example, between 6-month and 3-month Libor), Overnight Index Swap (OIS) vs. 3-month Libor spread and government bond spreads.
60 See note 19 to the financial statements.
61 For this ratio, short-term debt is debt with a fixed or optional maturity of one year or less at the point of acquisition – that is, it is not debt where the remaining maturity was one year or less at 31 December 2018.
62 Deductions are made to exclude revaluation reserves related to Banking assets (as operating assets are considered at cost).
63 With the exception of debt securities and loan investments, the fair value for the other amortised cost assets approximates to their carrying value due to the short-dated nature of these assets.
64 Adjusted for hedge accounting as applicable.
65 NAV = net asset value; EBITDA = earnings before interest, tax, depreciation and amortisation; DCF = discounted cash flow.
66 Banking share investments typically have an attached put and/or call option derivative. As such, any change in the underlying value of the equity may be offset by the change in the value of the derivative. For this reason, Banking share investments and the associated derivatives have been combined for the sensitivity analysis. For details of the EPF, see note 31.
67 Advanced countries are Croatia, Czech Republic, Estonia, Hungary, Latvia, Lithuania, Poland, Slovak Republic and Slovenia.
68 Early/intermediate countries are Albania, Armenia, Azerbaijan, Belarus, Bosnia and Herzegovina, Bulgaria, Cyprus, FYR Macedonia, Georgia, Kazakhstan, Kosovo, Kyrgyz Republic, Moldova, Mongolia, Montenegro, Romania, Serbia, Tajikistan, Turkmenistan, Ukraine and Uzbekistan.
69 Other member countries of the Organisation for Economic Co-operation and Development which are not classed as advanced or early/intermediate. www.oecd.org/about/membersandpartners/
70 This interest income equates to the unwinding of the discount on expected future cash flows from impaired financial assets.
71 See the Significant accounting policies, Property technology and equipment section for an explanation of this income.
72 The loans funded in this manner are predominantly denominated in Russian rouble and Turkish lira.
73 Such movements in foreign currency basis are recognised in the income statement as they occur where they apply to instruments not involved in a back-to-back hedging relationship where hedge accounting is applied. For instruments in designated hedging relationships, such movements are initially recognised in the statement of other comprehensive income as described in note 9.
74 Provisions for loans held at fair value through other comprehensive income equated to €9 million (2017: nil). These provisions form part of the overall balance for loans at fair value through other comprehensive income on the balance sheet.
75 Comprised of €247 million of new provisions against €76 million of released provisions (2017: €122 million against €106 million respectively).
76 Provisions raise in non-euro currencies create foreign exchange exposures which Treasury hedges. To the extent these hedges are transacted at different rates to the rates applied by the Bank’s accounting system to translate the provisions into the euro equivalent amounts, the difference is recognised as part of the overall provision charge in the income statement.
77 Excludes provisions for guarantees which are recorded in other assets.
78 Following the adoption of IFRS 9, some loans previously classified at amortised cost under IFRS 9 (2009) were reclassified at fair value through other comprehensive income. For more information on this change see the significant accounting policies section.
79 This movement in fair value relates to a hedge adjustment to fixed-rate loans that qualify for hedge accounting for interest rate risk.
80 Following the adoption of IFRS 9, some loans previously classified at amortised cost under IFRS 9 (2009) were reclassified at fair value through other comprehensive income. For more information on this change see the Accounting Policies section.
81 See note 30 for details of third parties.
82 The presentation of 2017 bond denominations has been changed. The change concerns the treatment of synthetic issuances, that is issuances where the underlying risks of the bond are in a different currency to those of the cash flows. Previously in this disclosure, such issuances were recorded in the currency of the cash flows, these are now presented in the underlying currency and the 2017 comparative figures have been amended to match the new presentation.
83 The voting power of members who have failed to pay any part of the amount due in respect of their obligations in relation to paid-in shares has been adjusted down by a percentage corresponding to the percentage which the unpaid amount due bears to the total amount of paid-in shares subscribed to by that member. Consequently the overall number of exercisable votes is lower than the total amount of subscribed shares.
84 Following notification in February 2019 from the Ministry of Foreign Affairs of the Republic of North Macedonia, in future editions of the Financial Report the country will be named North Macedonia.
85 For further details see the significant accounting policies section.
86 For further details see the significant accounting policies section.
87 Contributions for 2019 are expected to be €31 million.
88 All actuarial losses relate to changes in financial assumptions.
89 The 2017 financial statements are the most recent available.
90 Nuclear projects in the north west of Russia which are fully grant funded and managed by EBRD under the supervision of the Nuclear Operating Committee.
91 The NDEP includes a nuclear and non-nuclear programme.
92 See note 22.
93 The ERS does not meet the definition of a derivative as a large net investment was required from the holders of the ERS.